Figures & data
Figure 1. Schematic for synthesis of ferulic acid (FA)—Syringaldehyde ester (Compound 1). FA (2.0 g, 10 mmol) and syringaldehyde (3.0 g, 16 mmol) with 2 drops of sulfuric acid were refluxed in 40 ml of DMSO for 3 h. The progress of the reaction was monitored by thin layer chromatography, and it was stopped when there was no sign of any further reaction taking place. The resulting mixture was chromatographed on silica gel (hexane-dichloromethane, 1:1) to afford 3.2 g of compound 1: (E)-4-formyl-2,6-dimethoxyphenyl 3-(4-hydroxy-3-methoxyphenyl)acrylate. Brown liquid (Yield: 87%). IR (KBr): vmax (cm−1) 3450 (OH), 3005 (Ar C-H), 2958–2858 (CH), 1693 (C = O), 1593 (C = C), 1236 (C-O). 1H NMR (300 MHz, CDCl3): δH 9.87 (s, 1H), 7.83 (d, 1H), 7.24 (s, 1H), 7.24 (s, 1H), 7.13 (s, 1H), 6.95 (s, 1H), 6.87 (d, 1H), 6.87 (s, 1H), 6.76 (d, 1H), 5.23 (ArOH), 3.92 (s,3H, OCH3), 3.89 (s, 6H, 2 OCH3). 13 C NMR (75 MHz, CDCl3): δC 191.1, 154.4, 146.8, 146.7, 145.9, 144.9, 140.1, 137.9, 137.8, 136.8, 126.4, 120.4, 120.2, 114.6, 114.1, 111.7, 56.3, 56.0, 55.9. ESI-MS; m/z: 376.86 (M + 18) + observed for C19H18O7.
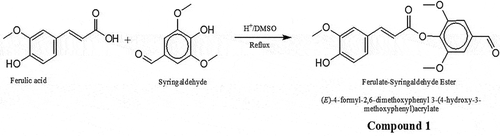
Figure 2. Schematic for synthesis of FA—Urethane Amide (Compound 2). FA (5.0 g, 25 mmol) and urethane (10.0 g, 112 mmol) with catalytic amount of imidazole were irradiated for 4 min in a domestic microwave oven operating at 600 W and frequency 14545 Hz. The average optimum time of reaction was initially studied to obtain the most appropriate time required for the complete reaction. Hence, reaction was left to progress for 5 min and product checked on the thin layer chromatography thereafter. The resulting mixture was chromatographed on silica gel and eluted with n-hexane to afford 3.5 g of compound 2: (E)-ethyl 3-(4-hydroxy-3-methoxyphenyl)acryloylcarbamate. Brown liquid (Yield: 51%). IR (KBr): vmax (cm−1) 3508–3300 (OH, NH), 3086 (Ar C-H), 2958–2858 (CH), 1815 (C = O), 1606 (C = C), 1238 (C-O). 1H NMR (300 MHz, MeOD): δH 7.8 (s, 1H, NH), 7.00 (dd, 2H), 6.67 (d, 1H, JHH 8.1, Hortho), 6.65 (d, 1H, JHH 8.1, Hortho), 6.66 (s, 1H, Ar-OH), 4.82 (s, 1H, Ar-OH), 3.84 (s, 3H, OCH3), 3.30 (m, 2H), 1.51 (t, 3H). 13 C NMR (75 MHz, MeOD): δC 148.9, 148.3, 147.5, 137.9, 129.3, 120.8, 116.1, 116.0, 111.3, 110.2, 56.4, 56.3, 19.46. ESI-MS; m/z: 283.08 (M + 18) + observed for C13H15NO5.
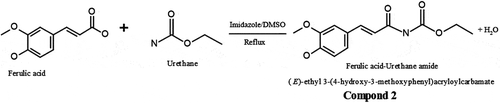
Figure 3. Inhibitory potential of ferulic ester and amide derivatives against degradation of deoxyribose: (A) non-specific inhibition; (B) specific inhibition. Data are presented as mean ± standard error of mean (SEM), n = 3.
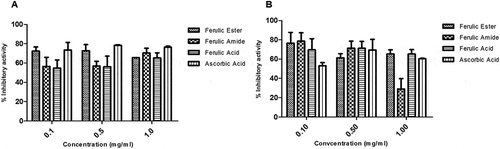
Figure 4. Activity of ferulic ester and amide derivatives. (A) Metal chelating. (B) Superoxide anion scavenging. (C) Hydroxyl radical scavenging. Data are presented as mean ± SEM, n = 3.
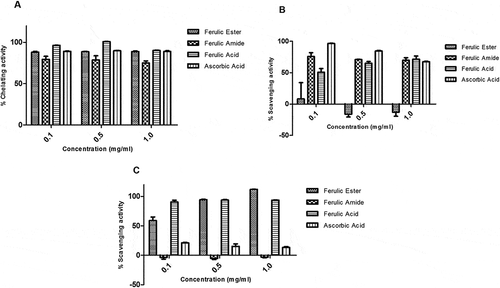
Figure 5. Protective activity of ferulic ester and amide derivatives against (A) peroxynitrite radical; (B) DPPH radical; (C) FRAP. Data are presented as mean ± SEM, n = 3.
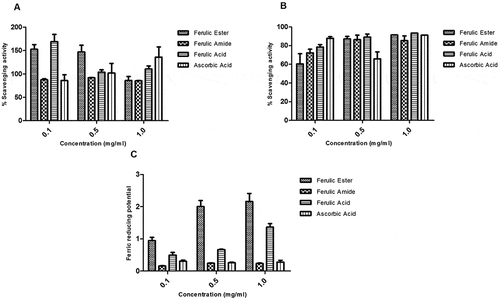
Figure 6. Total antioxidant and protective capacity of ferulic ester and amide derivatives: (A) total antioxidant capacity (TAC); (B) membrane stabilizing; (C) lipid peroxidation. Data are presented as mean ± SEM, n = 3.
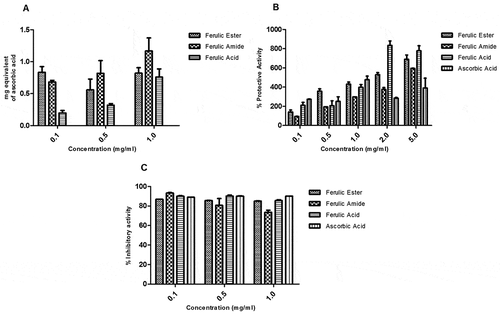
Figure 7. Computational prediction of binding mode: (A) original ligand (pink); (B) FA ester derivative (green) docked in the crystal structure of the breast cancer protein (cyan).
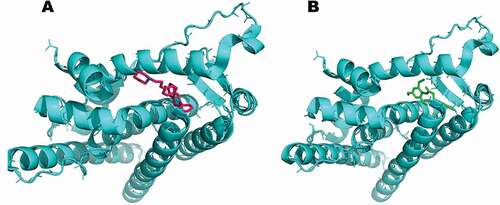
Figure 8. Interaction between receptor side chains and docked ligand. (A) Binding mode interactions of the original ligand with the receptor (Pdb Code: 1UOM), the ligand binds to the receptor residues GLU353, ARG 394 of chain A. (B) Binding mode interactions of the FA ester derivative the receptor (Pdb Code: 1UOM). The ligand binds to the receptor residues ARG 394, HIS524 of chain A. The ligand-interaction plots were generated using Discovery Studio (Acceryls Software, Inc).
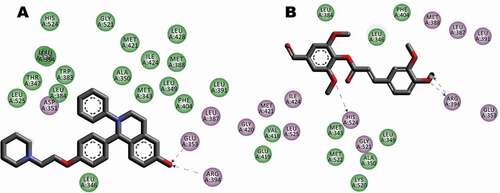
Figure 9. Computational prediction of binding mode: (A) original ligand shown in (cyan); (B) FA ester derivative shown (green) docked in the crystal structure of the oxidative stress protein (pink).
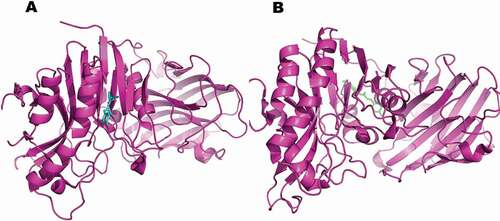
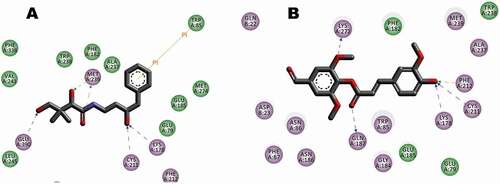
Figure 10. Interaction between receptor side chains and docked ligand. (A) Binding mode interactions of the original ligand with the receptor (Pdb Code: 4CYG), the ligand binds to the receptor residues CYS211, LYS178, GLU390 of chain A. (B) Binding mode interactions of the FA ester derivative the receptor (Pdb Code: 4CYG). The ligand binds to the receptor residues CYS211, LYS178, PHE212, and LYS272 of chain A. The ligand-interaction plots were generated using Discovery Studio (Acceryls Software, Inc).