
Figures & data
Table 1. Sensory scheme for pompano evaluation during storage.
Figure 1. Schematic diagram of (a) EN system; (b) MOS gas sensor; (c) EN gas chamber; and (d) detecting mechanism.
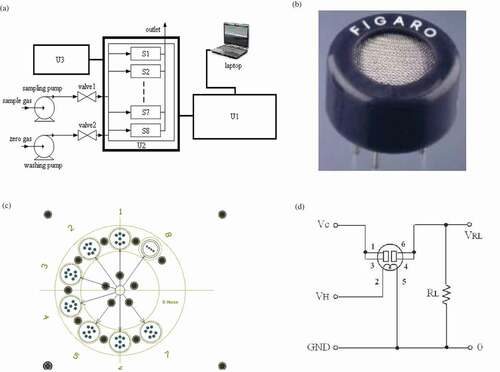
Figure 2. Physical/chemical indexes of golden pompanos: (a) firmness; (b) adhesiveness; (c) resilience; (d) TVB-N; (e) pH; (f) TVC; and (g) human sensory evaluation.
Figure 3. Spectroscopy analysis results: (a) original diffuse reflection responses; (b) two-dimensional PCA score plot; (c) SR SNR; (d) pompano quality predictive model using SR MaxSNR values of spectroscopy; and (e) forecasting accuracy evaluation of spectroscopy-based model.
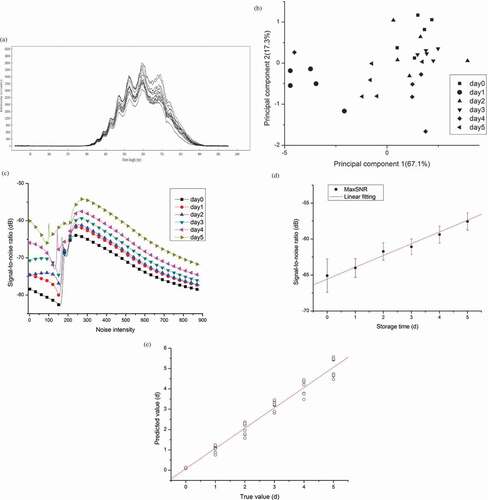
Figure 4. EN analysis results: (a) original response; (b) two-dimensional PCA score plot; (c) SR SNR spectrum; (d) pompano quality predictive model using SR MaxSNR values of EN; (e) forecasting accuracy evaluation of EN based model; and (f) forecasting accuracy evaluation of combined model.
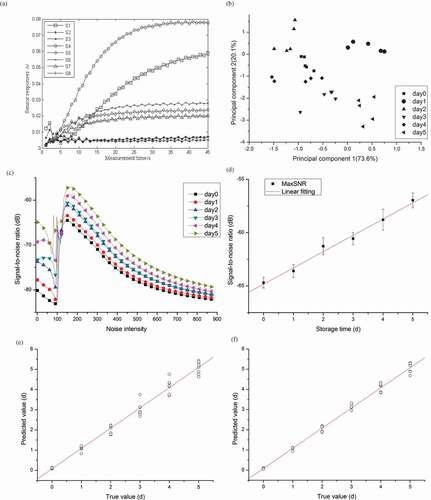
Table 2. Validating experiment results (√ = right; x = wrong; / = not calculated).