
Figures & data
Figure 1. Total volatile basic nitrogen (TVBN) (mg /100 g fish muscle) of fish during cold storage at 4°C.
Table 1. Texture changes in raw and cooked fish during cold storage at 4°C.
Figure 2. Changes in TCA-soluble peptide contents of fish during cold storage at 4°C.
Figure 3. SDS-PAGE patterns of fish during cold storage at 4°C. Numbers designate the storage time (days). Marker: molecular weight marker.
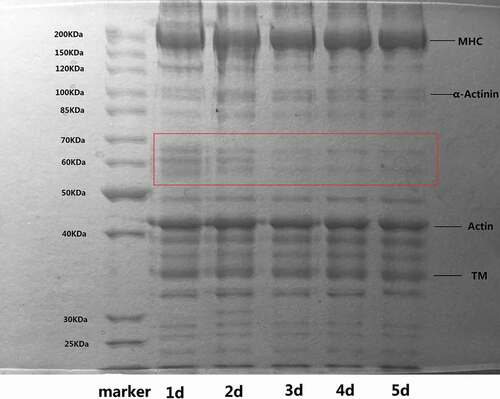
Table 2. Moisture content, cooking loss, and centrifugal loss of fish during cold storage at 4°C.
Figure 4. Typical NMR T2 curve of fish during cold storage at 4°C. P1, bound water; P2, immobilized water; P3, free water.
Figure 5. The changes in A2(a) and T2(b) of fish during cold storage at 4°C.
Table 3. PPMCCs of NMR (A21, A22, A23, T21, T22, T23) and texture (hardness, springiness, cohesiveness, gumminess, and chewiness).
Figure 6. Intermolecular bonds changes of fish during cold storage at 4°C.
Table 4. PPMCCs of immobilized water and intermolecular bonds (hydrophobic interactions and disulfide bonds).