Figures & data
Table 1. Chemical composition of Indonesian clove oil. The sequences in the table are from the lowest to the highest tr.
Figure 1. Typical GC-histogram of Indonesian clove leaf oil.
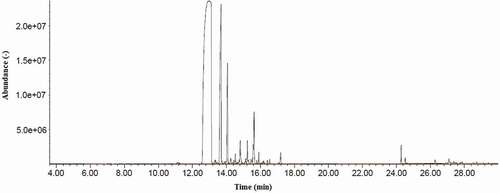
Figure 2. Viscosity profile of chitosan and sodium alginate solutions. (![]()
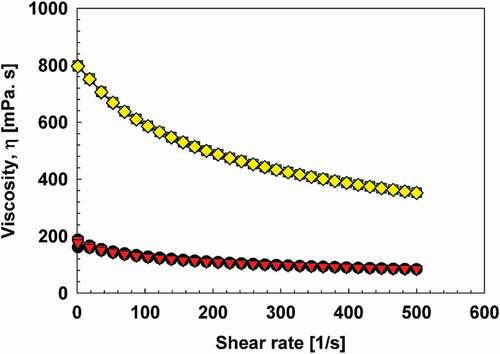
Table 2. ζ-potential of hydrocolloids solutions and the emulsion systems.
Table 3. Clove oil in chitosan (CC) and sodium alginate (CA) matrix parameters with reference to homogenization speeds and storage time. (a) The influence of homogenization speeds and (b) storage time.
Figure 3. Microscopy images of clove oil emulsions prepared at various homogenization speeds (a) chitosan and (b) sodium alginate. The scale bar is 10 μm.
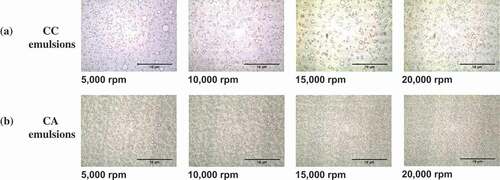
Figure 4. Droplet size and distribution of clove oil emulsions in chitosan (CC) and sodium alginate (CA) matrix. (a) Typical size distribution of CC and CA emulsions. (![]()
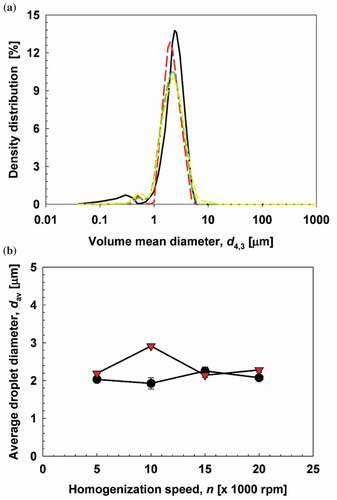
Figure 5. Stability of emulsions during 28 days of storage. Solid lines show CC emulsions, and dotted lines show CA emulsions. (![]()
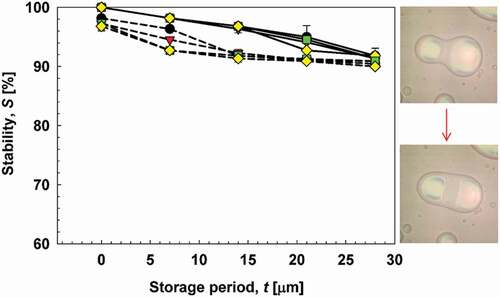
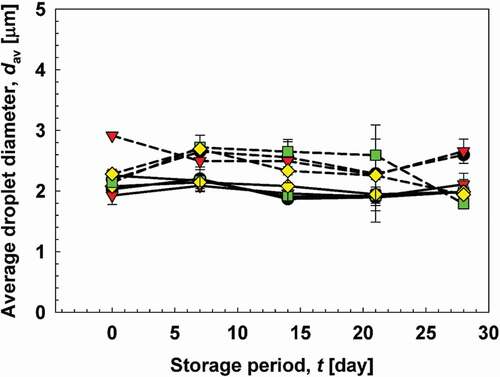
Figure 6. Average droplet diameter of CC and CA emulsions during 28 days of storage. The images show the course of emulsion coalescence. Solid lines show CC emulsions, and dotted lines shoe CA emulsions. (![]()