3,583
Views
35
CrossRef citations to date
0
Altmetric
Articles

Modification of bamboo shoot dietary fiber by extrusion-cellulase technology and its properties

, &
Pages 1219-1232 | Received 24 Nov 2017, Accepted 18 May 2018, Published online: 27 Jun 2018

Figures & data

Table 1. The TDF, SDF, and IDF contents of BSDF.

Figure 1. SEM of BSDF before and after modification, SEM (a) standard unmodified BSDF (500×), (b) standard modified by extrusion (500×), (c) standard modified by extrusion combined with cellulase (500×), (d) standard unmodified BSDF (3000×), (e) standard modified by extrusion (3000×), and (f) standard modified by extrusion combined with cellulase (3000×).

Figure 1. SEM of BSDF before and after modification, SEM (a) standard unmodified BSDF (500×), (b) standard modified by extrusion (500×), (c) standard modified by extrusion combined with cellulase (500×), (d) standard unmodified BSDF (3000×), (e) standard modified by extrusion (3000×), and (f) standard modified by extrusion combined with cellulase (3000×).

Figure 2. FTIR spectroscopy spectra of BSDF before and after modification; BSDF1: without any modification; BSDF2: modified by extrusion; BSDF3: modified by extrusion combined with cellulase.

Figure 2. FTIR spectroscopy spectra of BSDF before and after modification; BSDF1: without any modification; BSDF2: modified by extrusion; BSDF3: modified by extrusion combined with cellulase.

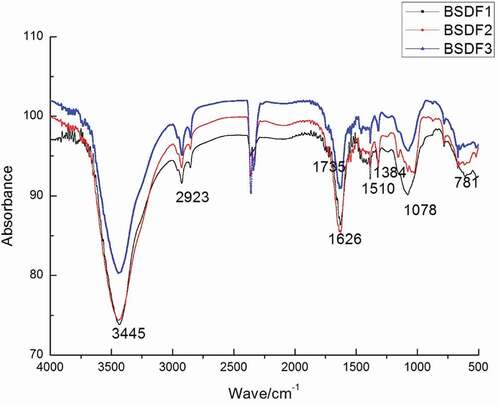
Table 2. Physicochemical properties of BSDF subjected to different treatments.

Figure 3. The cation exchange capacity of with different BSDF before and after modification; BSDF1: without any modification; BSDF2: modified by extrusion; BSDF3: modified by extrusion combined with cellulase.

Figure 3. The cation exchange capacity of with different BSDF before and after modification; BSDF1: without any modification; BSDF2: modified by extrusion; BSDF3: modified by extrusion combined with cellulase.

Figure 4. Glucose adsorption capacity of BSDF before and after modification. Lowercase letters indicate significant differences (p < 0.05), and bars indicate the standard deviation from three replicates.

Figure 4. Glucose adsorption capacity of BSDF before and after modification. Lowercase letters indicate significant differences (p < 0.05), and bars indicate the standard deviation from three replicates.

Figure 5. Cholesterol adsorption capacity before and after modification. Lowercase letters indicate significant differences (p < 0.05), and bars indicate the standard deviation from three replicates. pH 2 standard in vitro simulation of human stomach, and pH 7 standard in vitro simulation of human small intestine.

Figure 5. Cholesterol adsorption capacity before and after modification. Lowercase letters indicate significant differences (p < 0.05), and bars indicate the standard deviation from three replicates. pH 2 standard in vitro simulation of human stomach, and pH 7 standard in vitro simulation of human small intestine.

Figure 6. Nitrite ion adsorption capacity before and after modification. Lowercase letters indicate significant differences (p < 0.05), and bars indicate the standard deviation from three replicates. pH 2 standard in vitro simulation of human stomach, and pH 7 standard in vitro simulation of human small intestine.

Figure 6. Nitrite ion adsorption capacity before and after modification. Lowercase letters indicate significant differences (p < 0.05), and bars indicate the standard deviation from three replicates. pH 2 standard in vitro simulation of human stomach, and pH 7 standard in vitro simulation of human small intestine.