
Figures & data
Figure 1. Visible and near infrared reflectance spectra from scanning pea flour samples by using a miniature fiber optic spectrometer (StellarNet Inc., USA). The X-axis is wavelength (nm) and Y-axis is the reflectance (%).

Table 1. Descriptive statistics of the data sets for amylose, resistant starch, digestible starch, and total starch determined by enzymatic colorimetric assay.
Table 2. Comparison of the PLS models using different data preprocessing procedures.
Table 3. Highly correlated wavebands and corresponding correlation coefficients (in parentheses) for estimating amylose, resistant starch, digestible starch, and total starch.
Table 4. The multiple linear regression models (MLR) and adjusted coefficients of determination (adj. R2) for amylose, resistant starch, digestible starch, and total starch estimation using the most significant vis–NIRS wavebands.
Figure 2. Comparison of the laboratory-measured resistant starch, digestible starch, amylose, and total starch with the vis–NIRS model estimated values.
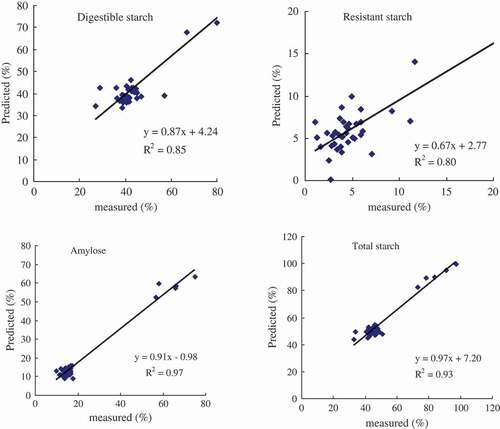
Table 5. Correlation matrix among resistant starch, digestible starch, amylose, and total starch determined by chemical methods.