
Figures & data
Figure 1. HPLC conditions of the extract of Sonchus Brachyotus DC. Kromasil C18 column (250 × 4.6 mm i.d.; 5 μm). (A) Mobile phase; (B) organic acid; (C) 3D wavelength scan chromatogram of the extract of Sonchus Brachyotus DC.; (D) flow rate; and (E) column temperature.
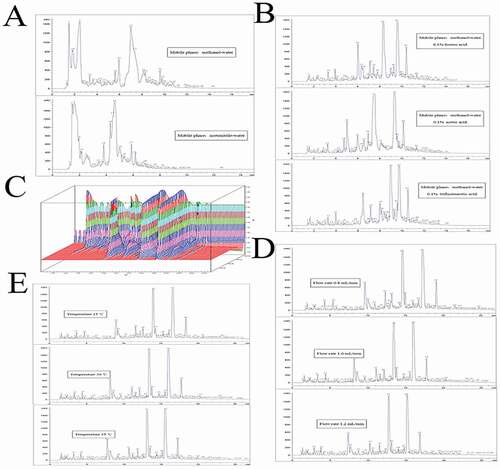
Figure 2. A representative fingerprint extract of Sonchus Brachyotus DC. Peaks 1–29 were used as common characteristic peaks.
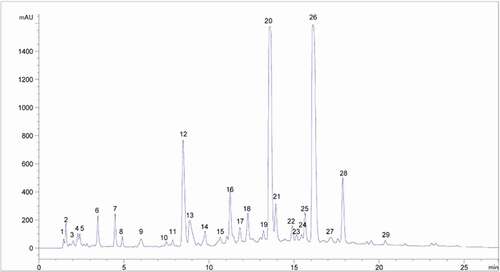
Table 1. Precision, repeatability, and stability data of the proposed method.
Figure 3. The overlay HPLC fingerprints of 10 batches samples of Sonchus Brachyotus DC. (1–10) by a similarity evaluation system that analyses sample similarity against a generated reference chromatogram (R).
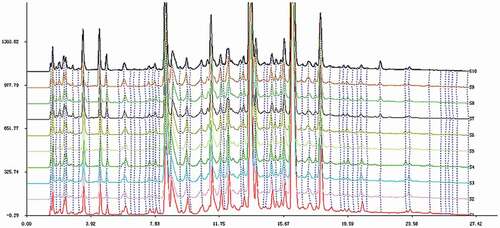
Table 2. The similarities (correlation coefficients) and the TAC of 10 batches.