
Figures & data
Figure 1. Dielectric platform with isometric view of (a) printed circuit board (PCB), and (b) plastic container, (c) PCB top view (with distances and
), and (d) bottom view.
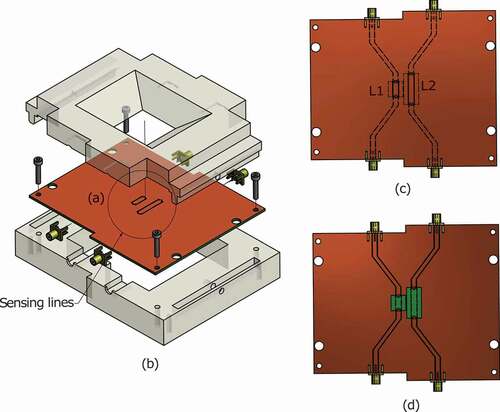
Figure 2. Dielectric platform and Keysight N1501 probe measurements: dielectric constant (DC) [left axis] and loss factor (L) [right axis] for (a) water, (b) methanol, (c) ethanol, and (d) biodiesel.
![Figure 2. Dielectric platform and Keysight N1501 probe measurements: dielectric constant (DC) [left axis] and loss factor (L) [right axis] for (a) water, (b) methanol, (c) ethanol, and (d) biodiesel.](/cms/asset/6bb34e68-eb6b-4795-8866-5b5e126dbe8d/ljfp_a_1490320_f0002_oc.jpg)
Figure 3. Comparison of (a) dielectric constant and (b) loss factor for green coffee in this study and parchment coffee in.[Citation14]
![Figure 3. Comparison of (a) dielectric constant and (b) loss factor for green coffee in this study and parchment coffee in.[Citation14]](/cms/asset/a8fbcf59-a677-4e9c-8bf3-a12c113d6d1d/ljfp_a_1490320_f0003_oc.jpg)
Figure 4. Mean and standard deviation, minimum, and maximum values for the dielectric constant of (a) coffee cherries and pulped coffee and (b) green and roasted coffee. Mean and standard deviation, minimum, and maximum values for the loss factor of (c) coffee cherries and pulped coffee and (d) green and roasted coffee.
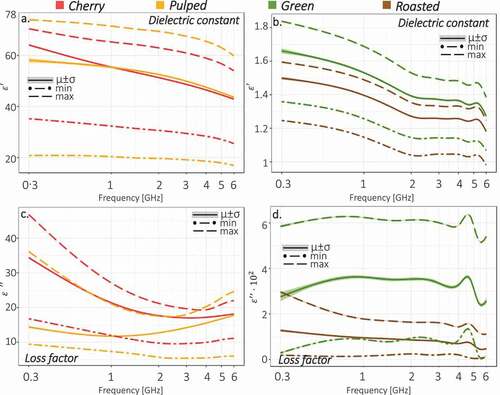
Figure 5. Absolute Pearson correlation for every dielectric attribute and all processing stages.
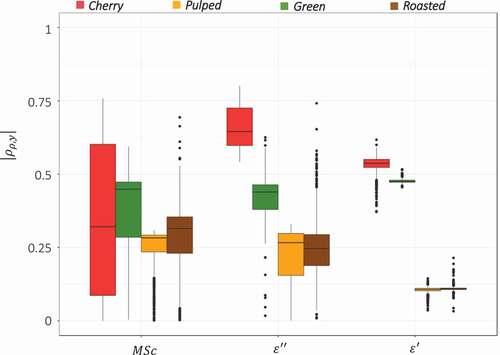
Figure 6. PLS biplot of coffee cherry samples for moisture content estimation - (a) scores (b) loadings for 15 frequencies.
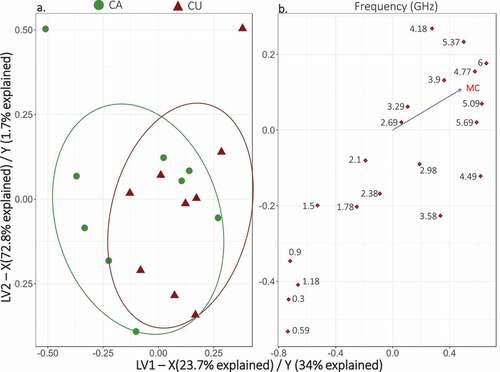
Figure 7. PLS biplot of green coffee samples for moisture content estimation - (a) scores (b) loadings for 15 frequencies.
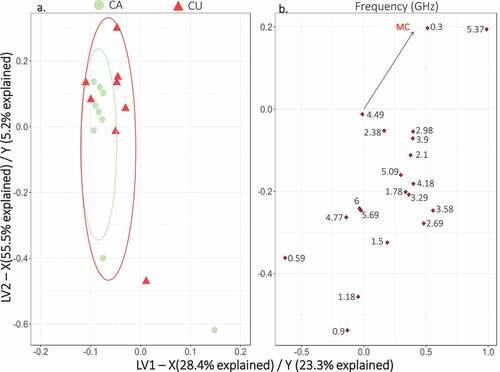
Table 1. Root mean square error (RMSE) and cross-validated determination coefficient (Q2) for moisture content (MC) models (calibration (C)/prediction (P)).