Figures & data
Figure 1. Changes in ATP content of tilapia skeletal muscles during 36 h of storage, as analyzed with HPLC. Bars represent the standard error of the mean. Different letters indicate significant difference (P < 0.05).
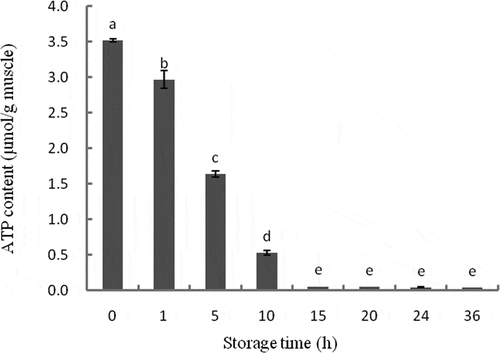
Table 1. Correlations among ATP, caspase-3 activity, and different apoptosis factors.
Figure 2. Changes in caspase-3 activity of tilapia skeletal muscles during 36 h storage. The activity is expressed in the fold change relative to 0 h. Different letters indicate significant difference (P < 0.05).
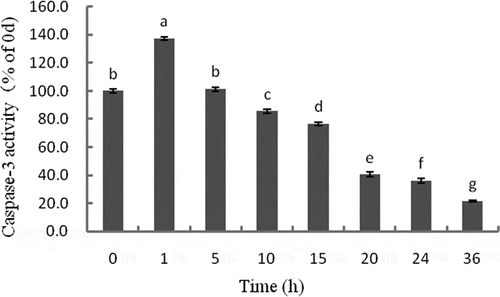
Figure 3. Western blot analyses of relative changes in mitochondrial cytochrome c (a), cytosolic cytochrome c (b), GAPDH of mitochondrial protein fractions (c), and GAPDH of cytosolic protein fractions (d) in tilapia skeletal muscles during 36 h of storage. The expression levels of cytochrome c in the mitochondria and cytosol are expressed in terms of ratios to the protein density at 0 h (e). Bars represent the standard error of the mean.
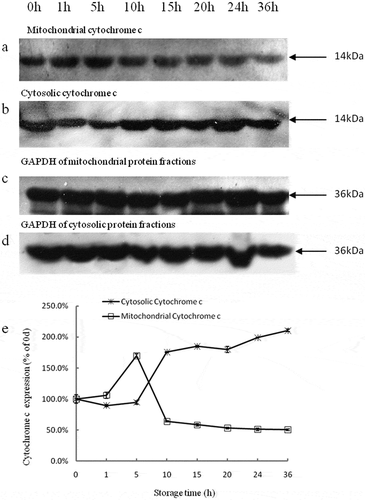
Table 2. Changes in band density ratios of Bax to GAPDH, Bcl-2 to GAPDH, and Bcl-2 to Bax during 36 h of storage.
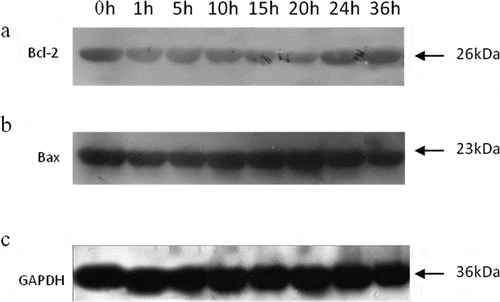
Figure 4. Western blot analyses of Bcl-2 (a), Bax (b), and GAPDH (c) in tilapia skeletal muscles during 36 h of storage.