
Figures & data
Table 1. The total phenolic, tannin contents, and antioxidant activities of HAP extracted by different solventsa.
Table 2. Characterization of the main phytochemicals in different HAP extracts by UPLC-ESI-QTOF-MS/MS.
Figure 1. Total ion chromatogram (TIC) in negative ion mode (A1, A2) and DAD chromatogram at 280 nm (B1, B2); A1, B1: 0–30 min, A2, B2: 30–70 min.
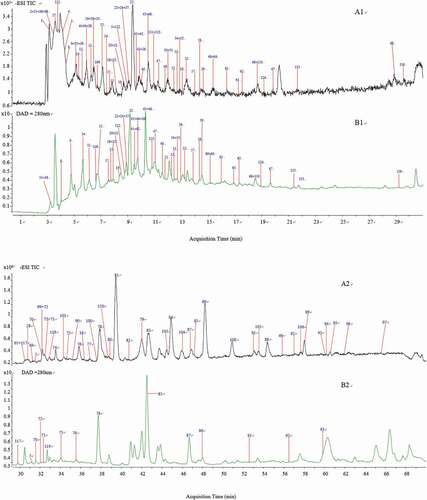
Figure 2. MS/MS spectra and fragmentation patterns of some typical phetochemicals of the peduncles of Hovenia acerba Lindl.: gentiobiose (A); citric acid (B); protocatechuic acid (C); ferulic acid (D); rutin (E); ampelopsin (F); catechin (G); ceanothetric acid (H); jujubogenin (I); ceanothic acid (J); and oleanolic acid (K).
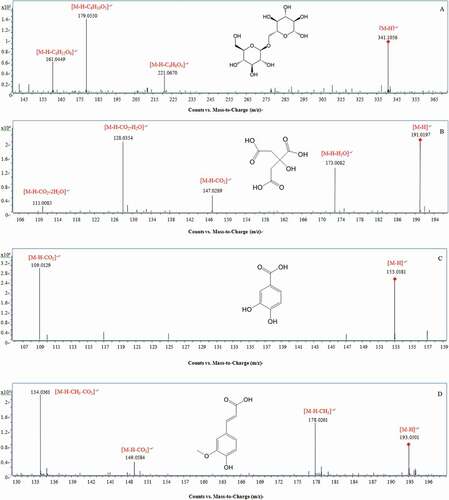
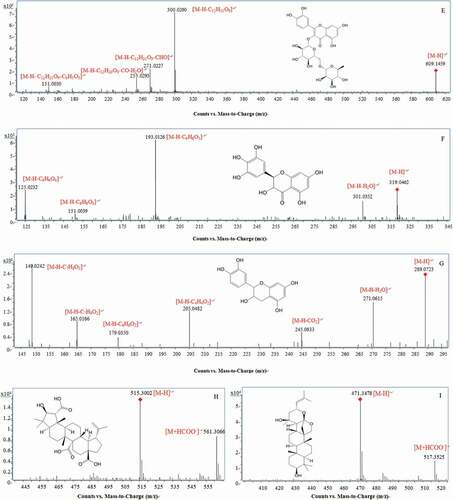
Figure 2. Continued.
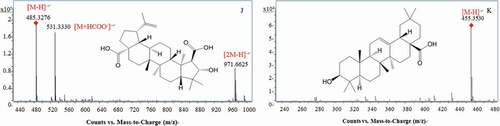
Table 3. Calibration curve equatuin and results from UPLC-QqQ-MS/MS for the major chemical constituents in HAPa.