Figures & data
Figure 1. The schematic diagram of the complexation mechanism of Ca(II)-chitosan conjugates.
Table 1. Height, roughness (Ra, Rq) and surface area difference of the self-assembly of chitosan molecules in different chitosan concentrations.
Figure 2. TypicalAFM height images of chitosan assembly on mica surface at different concentrations. (a) 0.01 mg/mL, (b) 0.02 mg/mL, (c) 0.05 mg/mL, (d) 0.1 mg/mL, (e) 0.2 mg/mL, (f) 0.5 mg/mL, (g) 1 mg/mL, (h) 2 mg/mL, and (i) 3 mg/mL.
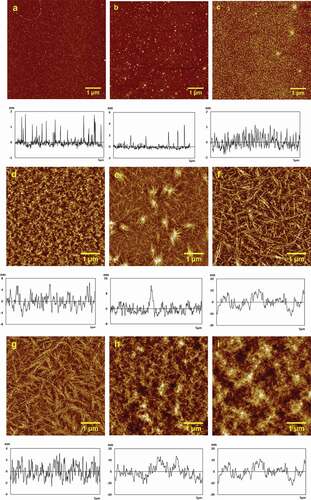
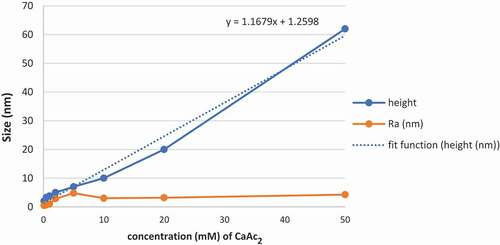
Table 2. Height, roughness (Ra, Rq) and surface area difference of the self-assembly of 50 μg/mL chitosan molecules in different CaAc2 concentrations.
Figure 3. Typical AFM height images of 50 μg/mL chitosan assembled on mica surface in different concentration of CaAc2. (a) 0.1 mM, (b) 0.2 mM, (c) 0.5 mM, (d) 1 mM, (e) 2 mM, (f) 5 mM, (g) 10 mM, (h) 20 mM, and (i) 50 mM.
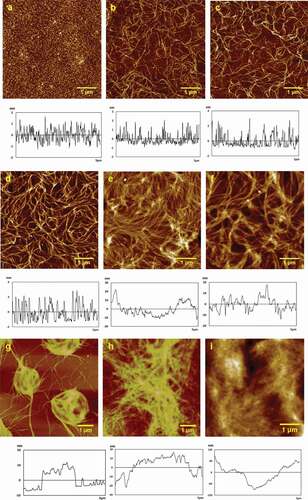
Figure 4. The line chart of height and Ra change with concentration.