
Figures & data
Figure 1. The used e-nose system.
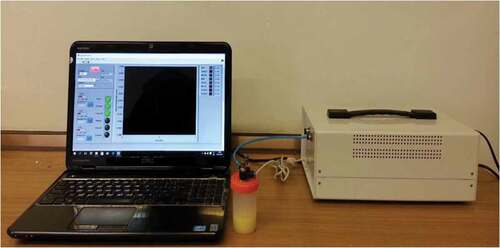
Table 1. The used sensors in electronic nose.
Figure 2. Radar graph response of the sensors for pure cow ghee (a), pure sunflower oil (b) and pure cow body fat (c).
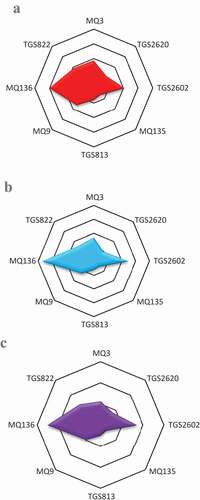
Figure 3. Loading plot (a) and score plot (b) of PCA analysis in the diagnosis of cow ghee mixed with sunflower oil.
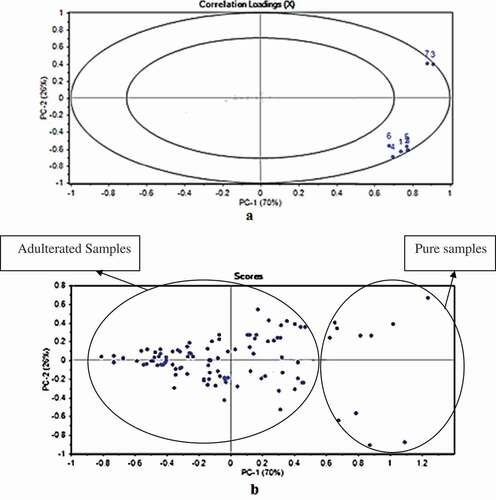
Figure 4. Loading plot (a) and score plot (b) of PCA analysis in the diagnosis of cow ghee mixed with cow body fat.
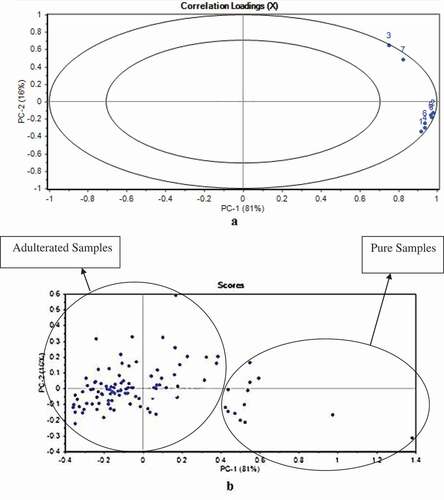
Table 2. Confusion matrix obtained to identify cow ghee from adulterated with sunflower oil.
Table 3. Artificial neural network results for adulteration with sunflower oil.
Table 4. Confusion matrix obtained to identify cow ghee from adulterated with cow body fat.
Table 5. Artificial neural network results for adulteration with cow body fat.