
Figures & data
Figure 4. Roma tomato (n = 30) density: mean estimated density (imaging method) versus mean actual density (buoyant force method).
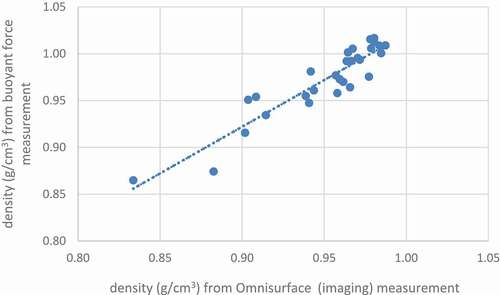
Table 1. Volume and density of salad tomatoes, roma tomatoes, mushrooms, and strawberries.
Figure 1. Mushroom (n = 35) measurement accuracy comparison: mean estimated volume (imaging method) versus mean actual volume (buoyant force method).
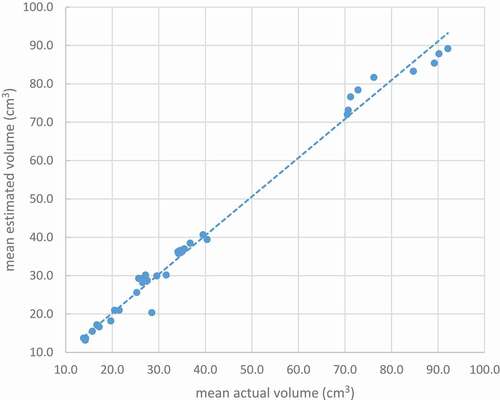
Figure 2. Strawberry (n = 35) measurement accuracy comparison: mean estimated volume (imaging method) versus mean actual volume (buoyant force method).
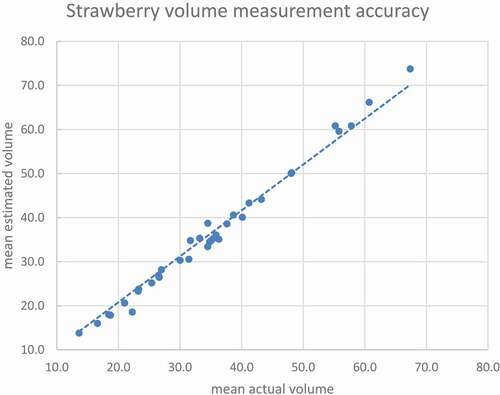
Figure 3. Mushroom (n = 35) density: mean estimated density (imaging method) versus mean actual density (buoyant force method).
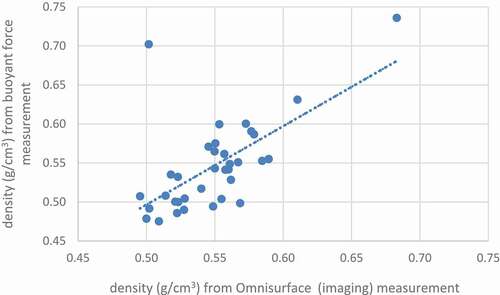
Table 2. Fruit volume estimation from weight measurement.