Figures & data
Table 1. Olive cultivars from different geographic regions.
Table 2. Overall effect of region, cultivar, and harvest year factors on volatile compounds of olive oil (means ± SD) (AU×10−6).
Figure 1. Principal component analysis biplot of relationships between regions and chemical groups of volatile compounds.
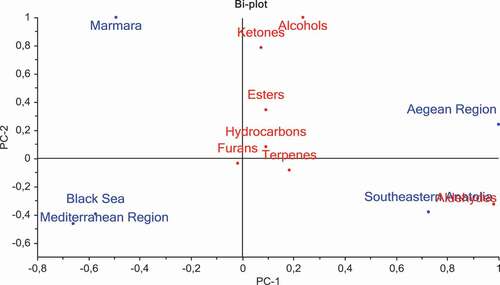
Figure 2. Loading plots of principal component analysis (PCA) results obtained from volatile compounds of regions.
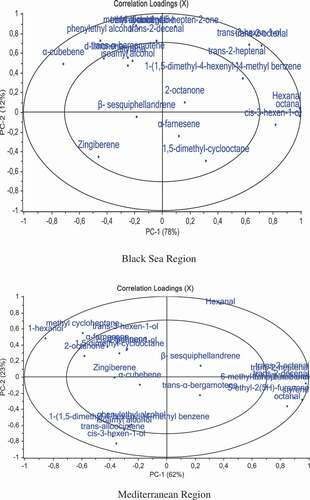
Figure 2. (Continued).
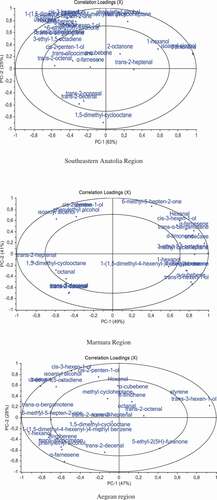
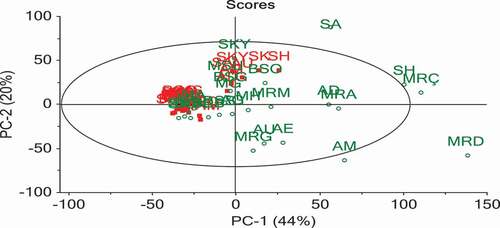
Figure 3. Loading plots of principal component analysis results obtained from harvest year of cultivars (red color: first year; green color: second year) (abbreviations are given in ).