Figures & data
Table 1. The fruit weight and pulp weight of quince fruit from different localities.
Table 2. Chemical analysis of quince fruit pulp.
Table 3. Carbohydrate, reducing sugar, and non-reducing sugars of quince fruit pulp.
Figure 1. Ascorbic acid (mg/100 g) of quince fruit pulp.
L1: Locality Abbaspur; L2: Locality Hajira; L3: Locality Mandhole; L4: Locality Rawalakot; L5: Locality Thorar.
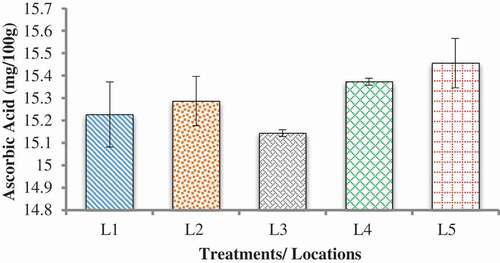
Figure 2. Total phenolic content of quince fruit pulp.
L1: Locality Abbaspur; L2: Locality Hajira; L3: Locality Mandhole; L4: Locality Rawalakot; L5: Locality Thorar.
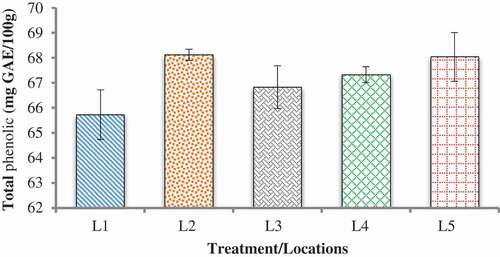
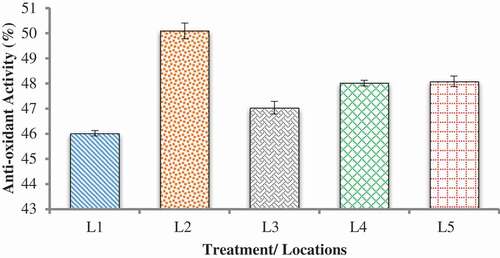
Figure 3. Antioxidant activity (%) of quince fruit pulp.
L1: Locality Abbaspur; L2: Locality Hajira; L3: Locality Mandhole; L4: Locality Rawalakot; L5: Locality Thorar.