Figures & data
Table 1. Sample sampling time at different temperatures.
Table 2. The first-order kinetic exponential equation of carbonyl, TBARS, and POV with storage time at different temperatures.
Table 3. Verification and predicted values of carbonyl, TBA, and POV in validation tests.
Table 4. Volatile compounds identified in headspace of bovine liver.
Table 5. Consumer acceptance of bovine liver paste prepared with bovine liver stored at different temperatures for 10 and 20d, p<0.05.
Figure 1. Change total plate count in bovine liver stored at different temperature (black, −20℃; red, −10℃; blue, 0℃; purple, 10℃; green, 20℃).
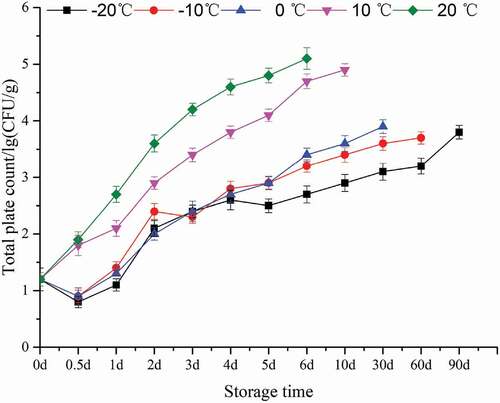
Figure 2. Change of carbonyl contents in bovine liver stored at different temperature (black, −20℃; red, −10℃; blue, 0℃; purple, 10℃; green, 20℃) for 30 days.
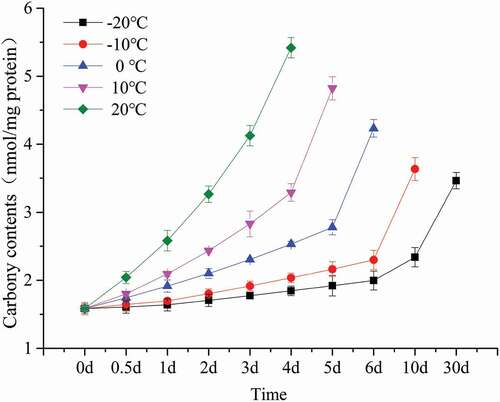
Figure 3. Change of TBA in bovine liver stored at different temperature (black, −20℃; red, −10℃; blue, 0℃; purple, 10℃; green, 20℃) for 90 days.
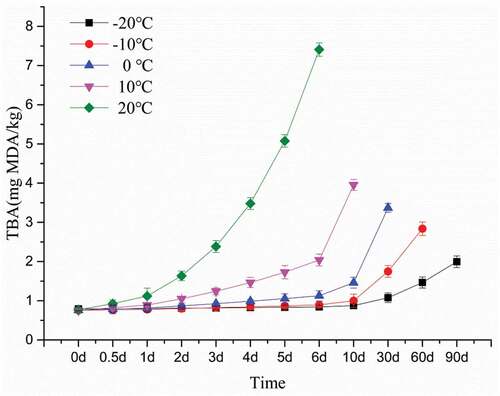
Figure 4. Change of POV in bovine liver stored at different temperature (black, −20℃; red, −10℃; blue, 0℃; purple, 10℃; green, 20℃) for 90 days.
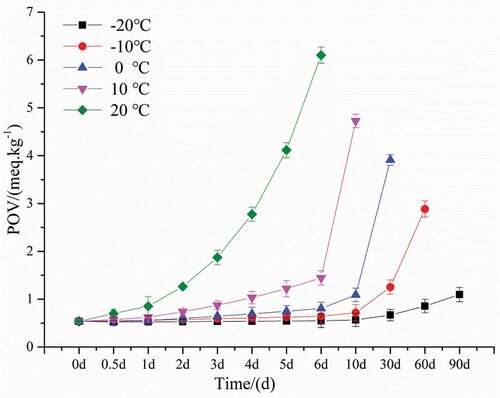
Figure 5. Arrhenius curve of rate of change of carbony (A), TBA (B) and POV (C) content.
Figure 6. Heat map representing relative peak area of volatile compounds detected by GC-MS in bovine liver stored at different temperatures and periods (green color means low peak area and red color is high in peak area, relatively).
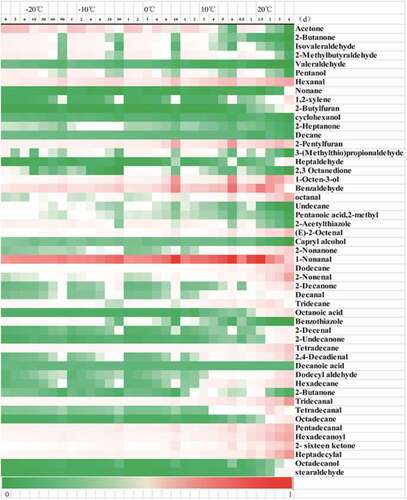
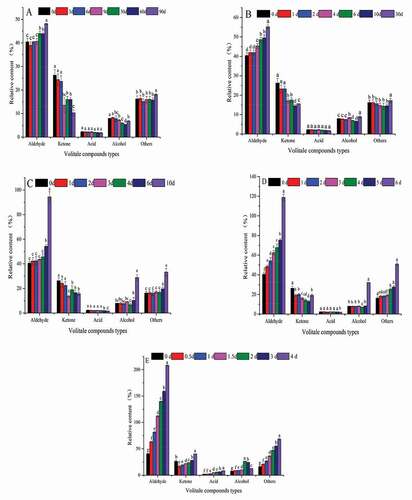
Figure 7. Relative content of different types of volatile compounds in bovine liver at different temperatures during different time (A,-20℃; B,-10℃; C,0℃; D, 10℃; E, 20℃).