Figures & data
Table 1. Definition and reference standards of fava paste taste, aroma, color, and appearance used for sensory evaluation.
Figure 1. Consumer preference and overall liking score of the five fermented fava pastes. The x-axis represents the five traditional fava pastes samples mentioned in this work. The y-axis in the left represents the overall liking of consumer, while the y-axis in the right represents the percentages of “liked extremely” and “extremely disliked” obtained from consumer investigation. All experiments repeated three times. Different superscript letters in overall liking bar denote significant difference (p = 0.05) among the five tested samples.
Figure 2. Sensory score of the five tested fava pastes.
Figure 3. The contents of main constituent of five fava pastes. (a) The main compounds of the concentration above 18.0 g/100 g, including water, ash, salt, protein, and dietary fiber. (b) The main compounds of the concentration below 3.0 g/100 g, including fat, total acid, and amino nitrogen. All experiments repeated three times. Error bars represent 95% confidence intervals. Different letter superscripts in the same indicators denote significant difference (p = 0.05).
Figure 4. Vitamin contents of the five tested fava pastes, including VB2, α-E, γ-E, δ-E, and total VE. All experiments repeated three times. Error bars represent 95% confidence intervals. Different letter superscripts in the same indicators denote significant difference (p = 0.05).
Figure 5. Contents of the dominant mineral element detected in the five fava pastes, including K, Na, Ca, P, and Fe. Error bars represent 95% confidence intervals. All experiments repeated three times. Different letter superscripts in the same indicators denote significant difference (p = 0.05).
Table 2. Free amino acids (FAAs) profile of the five tested fava pastes.
Table 3. Distribution of molecular weight of fava pastes.
Table 4. Volatile compounds in the five tested fava pastes.
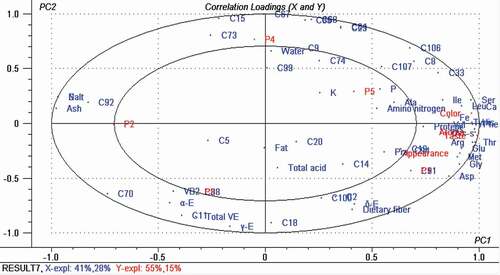
Figure 6. PLS2 correlation loading plot of five fava pastes-based physicochemical attributes (water, protein, fat, dietary fiber, ash, salt, total acid, amino nitrogen), FAAs (Asp, Glu, Ser, Gly, His, Thr, Arg, Ala, Tyr, Cys, Val, Met, Phe, Ile, Leu, Lys, and Pro), mineral elements, vitamin, and key volatile compounds determined in this study. Ellipses represent r2 = 0.5 and 1.0, respectively.