Figures & data
Figure 1. The experimental setup.
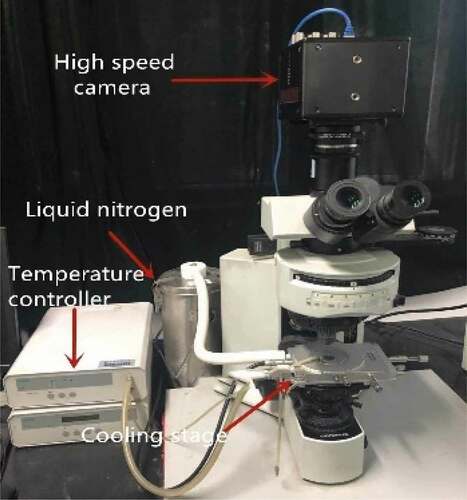
Figure 2. In experimental pictures, changes of intercellular space and light transmission at room temperature in two states: (a) cells with CB, (b) normal cells.
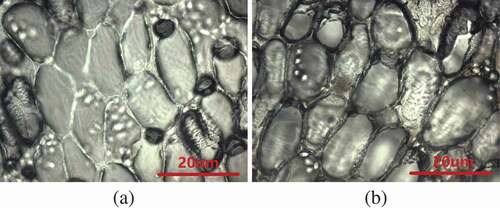
Figure 3. The intercellular space became larger after adding cytoskeleton B. The generated microstructure images at room temperature were presented: (a)cells with CB, (b) normal cells. (c) The variety of the cell porosity at room temperature.
Figure 4. In light intensity pictures, changes of light transmission at room temperature in two states: (a) cells with CB, (b) normal cells.
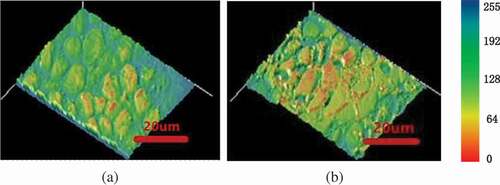
Figure 5. Progress of intracellular freezing in normal cells at a cooling rate of 20℃/min. These images were processed using filtering, and the contrast and brightness were adjusted using image analysis software. Temperature elapsed since the start of intracellular freezing: (a) 0℃, (b) −20℃, (c) −30℃, (d) −36℃.
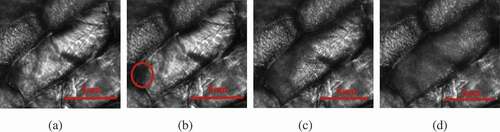
Figure 6. Progress of intracellular freezing in cells with CB at a cooling rate of 20℃/min. These images were processed using filtering, and the contrast and brightness were adjusted using image analysis software. Temperature elapsed since the start of intracellular freezing: (a) 0℃, (b) −20℃, (c) −24℃, (d) −31℃.
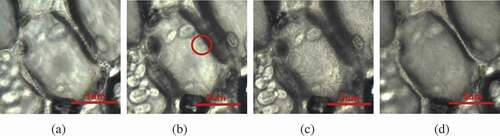
Figure 7. The relative gray-level variation of intracellular freezing in normal cells at a cooling rate of 20℃/min. Temperature elapsed since the start of intracellular freezing: (a) 0℃, (b) −20℃, (c) −30℃, (d) −36℃.
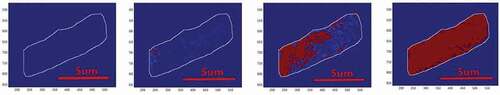
Figure 8. The relative gray-level variation of intracellular freezing in cells with CB at a cooling rate of 20℃/min. Temperature elapsed since the start of intracellular freezing: (a) 0℃, (b) −20℃, (c) −24℃, (d) −31℃.
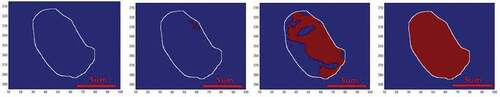
Figure 9. The probability of crystallization as a function of temperature at a cooling rate of 60℃/min in normal cells and cells with CB.
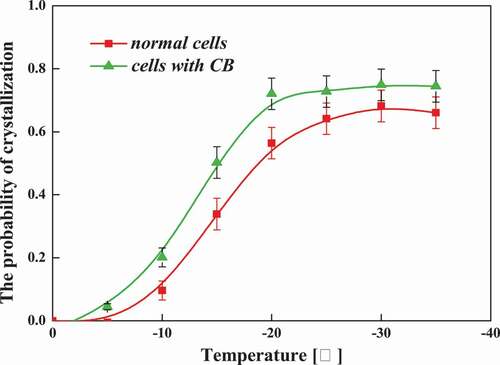
Figure 10. Intracellular ice crystal growing rate at different cooling rates in normal cells. The shaded area in the graphs distinguished between the cell wall and the center of a cell.
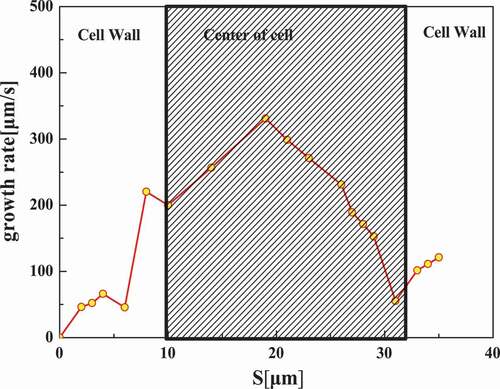
Figure 11. Intracellular ice crystal growing rate at different cooling rates in a cell with CB. The shaded area in the graphs distinguished between the cell wall and the center of the cell.
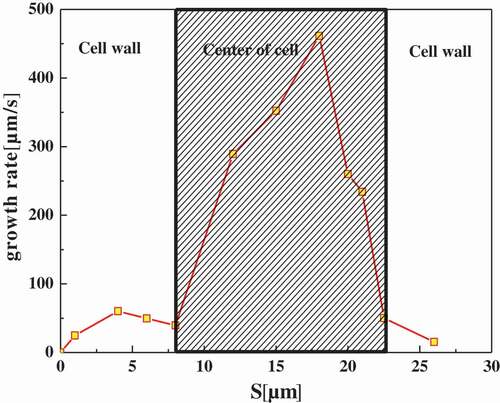
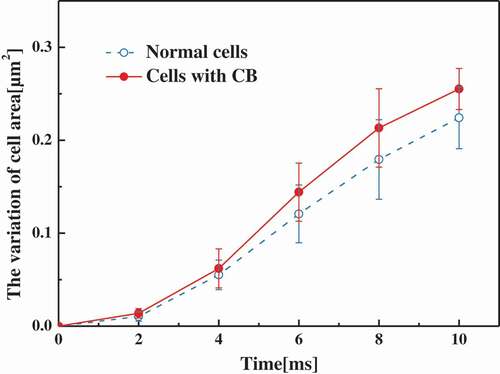
Figure 12. The variation of cell area as a function of time at a cooling rate of 60℃/min in normal cells and cells with CB.