
Figures & data
Table 1. QIM scheme for assessing whole ice storage Goldlined seabream Rhabdosargus sarba.
Figure 1. Linear correlation between QIM and storage time of Goldlined seabream Rhabdosargus sarba during the ice storage.
Figure 2. Partial least squares (PLS) regression for quality index method (QIM) of Goldlined seabream Rhabdosargus sarba during the ice storage and the predicted values.
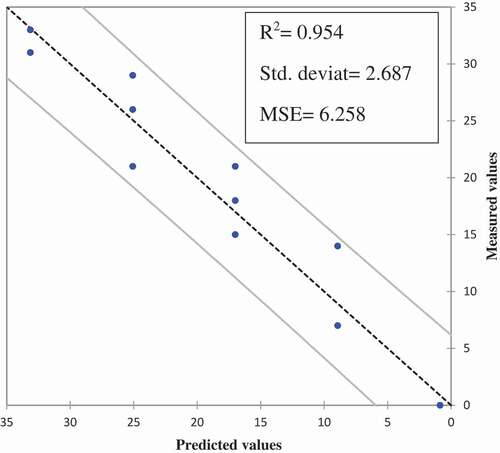
Figure 3. Average scores for each quality parameters assessed with the QIM scheme for Goldlined seabream Rhabdosargus sarba stored in ice and the correlation to days in ice: (A) Overall appearance; (B) Eye (C) Gill (D) Fins (E) Caudal fin (F) Dorsal (G) Abdomen (Internal) (H) Abdomen (outside) (I) Flesh.
Table 2. Microbiological evaluation of Goldlined seabream Rhabdosargus sarba during ice storage (log CFU/g).
Table 3. Goldlined seabream Rhabdosargus sarba physicochemical parameter changes during ice storage.
Table 4. Goldlined seabream Rhabdosargus sarba color parameters (a*, b*, L*, C*ab, Hºab, W) changes during ice storage.
Table 5. Rotated factor loading matrix (VARIMAX) for the community attributes and values and factor statistics.