
Figures & data
Figure 1. T-AOC activity of MRPs generated from CSBPs and different reducing sugars. CSBPs: crab shell bioactive peptides; TDPs: thermal degradation products. Bars represent the standard deviation. Different lowercase letters represent the significant differences (p< 0.05).
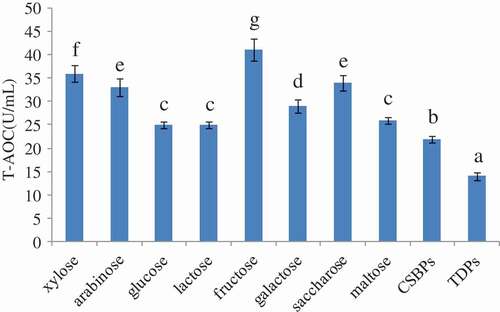
Figure 2. Browning index of the MRPs generated from CSBPs and fructose. All samples were diluted eight times with demonized water and measured at 420 nm. Bars represent the standard deviation.
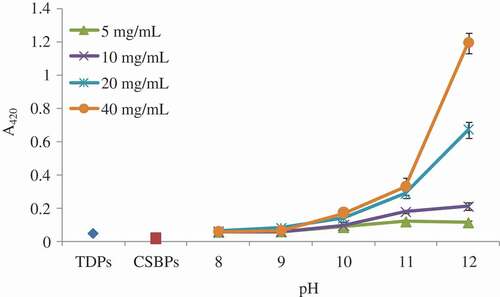
Figure 3. Antioxidant activities of the MRPs generated from CSBPs and fructose. Bars represent the standard deviation.
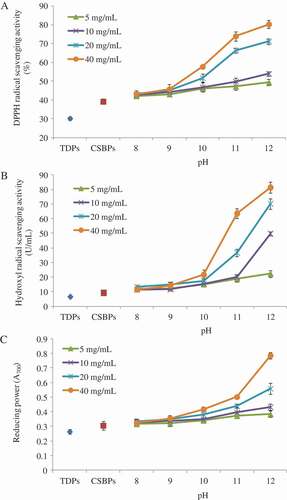
Table 2. The correlation coefficient between MRP properties and pH at different fructose concentration.
Table 3. The correlation coefficient between MRP properties and fructose concentration at different pH.
Table 1. Antibacterial activity of CSBPs, TDPs, and MRPs.
Figure 4. Total free amino acid concentration of the MRPs generated from CSBPs and fructose. Bars represent the standard deviation.
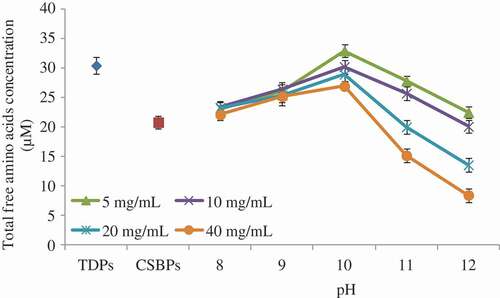
Figure 5. The molecular weight distribution of the MRPs generated from CSBPs and fructose. Size exclusion chromatograms using a TSKgel G2000SWXL column at a flow rate of 1.0 mL/min of pH 7.2 sodium phosphate buffer (0.02 M) containing 0.25 M NaCl. Molecular weight distributions of the CSBPs, TDPs, and MRPs were calculated according to the calibration curve. Bars represent the standard deviation.
Figure 6. Antioxidant activities of the MRPs with different molecular weight.
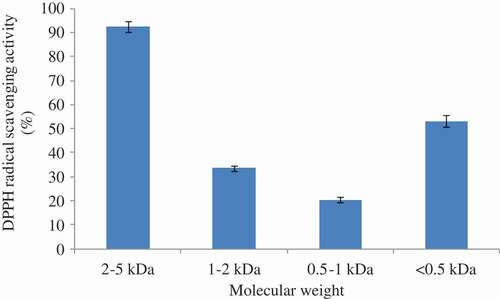
Table 4. Correlation analysis among different properties of MRPs at a fructose concentration of 40 mg/mL.