Figures & data
Table 1. Comparison of physicochemical and compositional characteristics of control and low-cholesterol ghee
Table 2. Fatty acid profile of low-cholesterol and control ghee
Figure 1. (a) Chromatogram of fatty acid methyl esters of low-cholesterol ghee. (b) Chromatogram of fatty acid methyl esters of control ghee
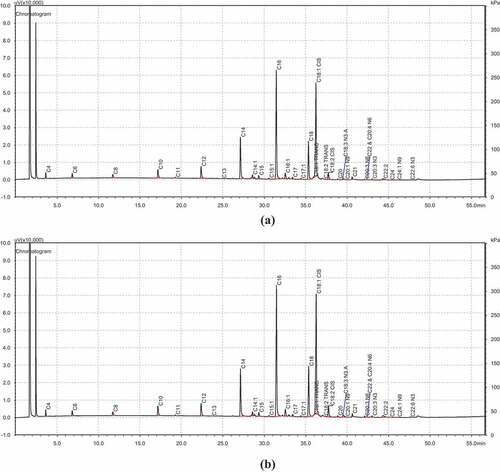
Table 3. Triacylglycerol (TAG) profile of control and low-cholesterol ghee
Figure 2. (a) Triglyceride profile chromatogram of control ghee. (b) Triglyceride profile chromatogram of low-cholesterol ghee