Figures & data
Figure 1. Structure diagram of the grain thin-layer drying test device with multi-parameter regulating function: 1. wind shunt; 2. axial flow fan; 3. material bin door; 4. material tray; 5. sensor bin; 6. electric sealing valve; 7. heating pipe; 8. inner tank; 9. wet exhaust fan; 10. test-bed shell; 11. sensor group; and 12. humidifier
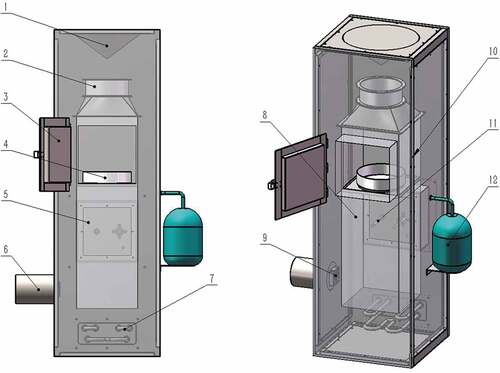
Figure 2. The grain thin-layer drying test device picture
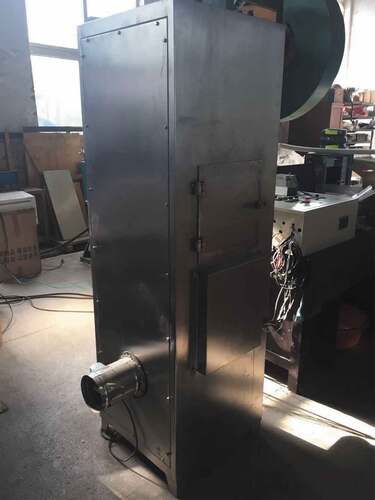
Table 1. Orthogonal test table of four factors and five levels
Table 2. Experimental statistical results
Table 3. Influence of various factors on the crack additional percentage of paddy
Figure 3. Response surface diagram of the influence of each control factor on the crack additional percentage. (a) Response surface diagram of the influence of X1 and X2 on the crack additional percentage. (b) Response surface diagram of the influence of X1 and X3 on the crack additional percentage. (c) Response surface diagram of the influence of X1 and X4 on the crack additional percentage. (d) Response surface diagram of the influence of X2 and X3 on the crack additional percentage. (e) Response surface diagram of the influence of X2 and X4 on the crack additional percentage. Response surface diagram of the influence of X3 and X4 on the crack additional percentage
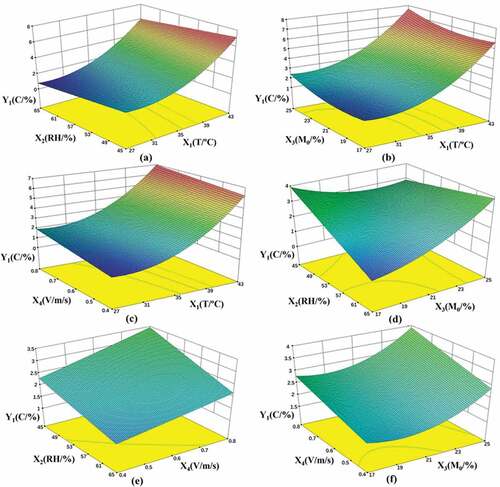
Table 4. Relative error table of the regression equation of the crack additional percentage of paddy
Table 5. Influence of various factors on the accumulated temperature of paddy
Figure 4. Response surface diagram of the influence of each control factor on the accumulated temperature. (a) Response surface diagram of the influence of X1 and X2 on the accumulated temperature. (b) Response surface diagram of the influence of X1 and X3 on the accumulated temperature. (c) Response surface diagram of the influence of X1 and X4 on the accumulated temperature. (d) Response surface diagram of the influence of X2 and X3 on the accumulated temperature. (e) Response surface diagram of the influence of X2 and X4 on the accumulated temperature. (f) Response surface diagram of the influence of X3 and X4 on the accumulated temperature
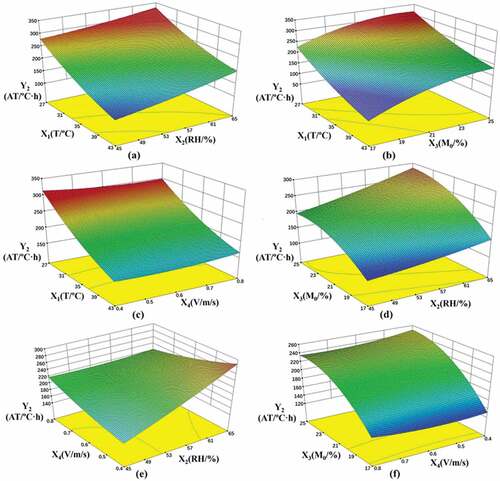
Table 6. Relative error of the regression equation of the accumulated temperature of paddy
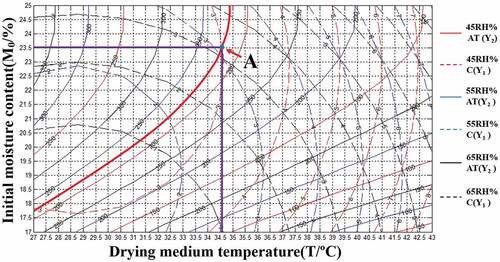
Figure 5. Contour map of the accumulated temperature and the drying quality