Figures & data
Table 1. Yield and pH of the bovine skin gelatin extracted using enzymes actinidin and papain at different levels. Values are given as mean±SE from triplicate determination
Table 2. Amino acid composition (%) of control gelatin, gelatin extracted using actinidin, and papain enzymes from the bovine skin
Figure 1. SDS-PAGE pattern of pretreated skin (PS) sample along with gelatin samples extracted using different levels of enzyme actinidin (A) and papain (P). A0/P0, A5/P5, A10, A15/P15, A20/P20, and A25/P25 refer to corresponding actinidin/papain enzyme level of 0, 5, 10, 15, 20, and 25 unit/g of skin, respectively. M: high-molecular-weight marker. C: control gelatin
Table 3. Turbidity, gel strength, and viscosity of the bovine skin gelatin extracted using enzymes actinidin and papain at different levels. Values are given as mean±SE from triplicate determination
Figure 2. Fourier-transform infrared spectra of control (C), GEA, and GEP gelatin samples extracted at the level of 20 units of enzyme/g of wet skin
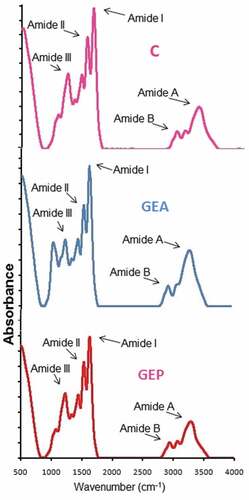
Figure 3. SEM images of control (C), GEA, and GEP gelatin samples extracted at the level of 20 unit of enzyme/g of wet skin. Magnification: 30⨰