Figures & data
Figure 1. (a) Finite cylinder with radius R and height L; (b) symmetrical slice defined by the angle Δθ; (c) Rectangle dividing the slice in the middle where a two-dimensional grid will be defined
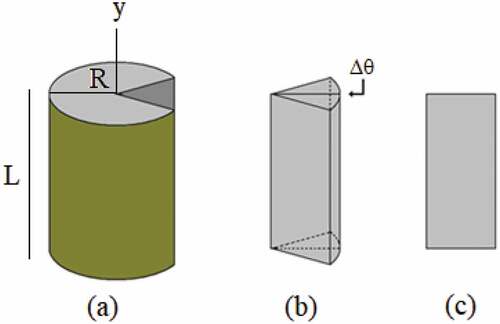
Figure 2. (a) Two-dimensional grid for the cylindrical geometry with boundaries north (N), south (S), west (W) and east (E); (b) Element of the two-dimensional grid highlighting the nodal point P; (c) Control volume for the cylindrical geometry
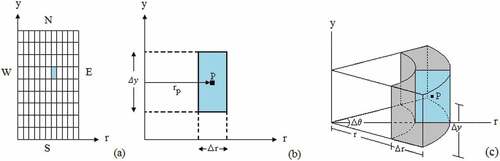
Figure 3. (a) Internal control volume, nodal point P and neighbors to the north (N), south (S), east (E) and west (W); (b) Control volume P at the east boundary and its neighbors
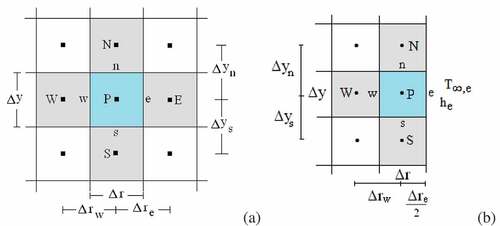
Table 1. Thermal properties (thermal diffusivity, thermal conductivity, convective heat transfer coefficient, heat transfer coefficient) determined by the proposed model and by Silva et al.[Citation8]
Figure 4. Cooling kinetics of the cucumber
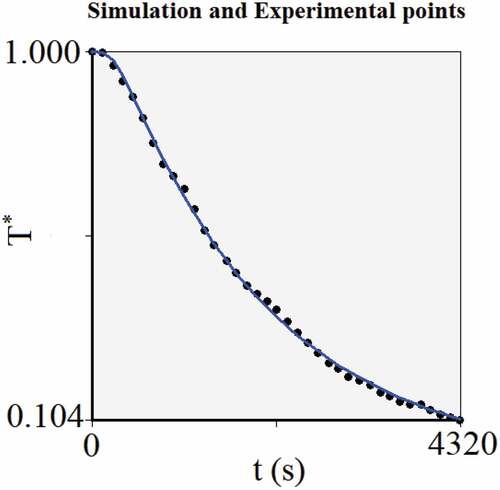
Figure 5. Error distribution. The continuous line represents the average error
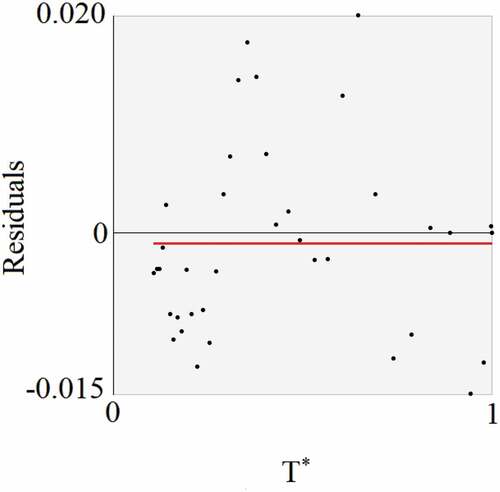
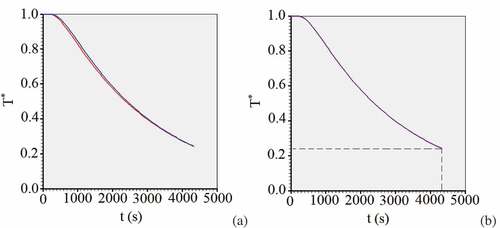
Figure 6. (a) Confidence band for the cooling process; (b) Cooling kinetics at the central point of a cucumber with radius R = 0.026 m and height L = 0.220 m, obtained for the average values of the thermal properties