Figures & data
Table 1. Information of honey samples collected
Figure 1. High-performance liquid chromatography chromatogram of (a) standard phenolic acid solution (20 μg/mL), (b) manuka honey: 1. gallic acid, 2. protocatechuic acid, 3. 2,3,4-trihydroxybenzoic acid 4. protocatechualdehyde, 5. p-hydroxybenzoic acid, 6. gentistic acid, 7. chlorogenic acid, 8. vanillic acid + caffeic acid, 9. syringic acid, 10. vanillin, 11. p-coumaric acid + syringaldehyde 12. ferulic acid, 13. sinapic acid, 14. Salicylic
Table 2. The phenolic acid contents (µg/g) of honey samples
Figure 2. UV-Vis spectrum of major phenolic compounds present in various honey samples (a) gallic acid, (b) protocatechuic acid, (c) 2,3,4-trihydroxybenzoic acid, (d) protocatechualdehyde, (e) p-hydroxybenzoic acid, (f) gentistic acid, (g) chlorogenic acid, (h) vanillic acid, (i) syringic acid, (j) vanillin, (k) p-coumaric acid, (l) ferulic acid, (m) sinapic acid, (n) Salicylic acid
Figure 3. High-performance liquid chromatography chromatogram of (a) standard flavonoids solution (100 μg/mL), (b) manuka honey: 1. Hesperitin, 2. Naringin, 3. Hesperidin, 4. Quercitrin, 5. Myricetin, 6. Morin, 7. Luteolin + Quercetin 8. Naringenin, 9. Apigenin, 10.Kaempferol, 11. Chrysin, 12. Galangin, 13.Tangeretin
Table 3. The flavonoids content (µg/g) in honey samples
Table 4. Total phenolic acids, total flavonoids and total phenolic compounds in honey samples from different countries
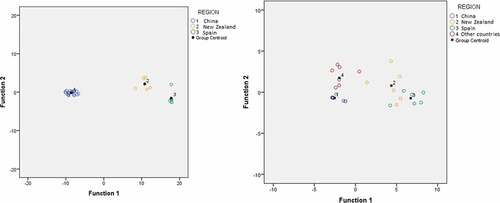
Table 5. Observation of discrimination models and cross-validation results for geographical classification of honey samples based on the phenolic profile
Figure 4. Scatter plot of honey samples (a) from three different regions (b) from four regions