Figures & data
Table 1. Experimental design with the response surface methodology for total phenolic compounds (TPC) yield extracted from Phyllanthus emblica fruit using microwave-assisted extraction (MAE) method
Figure 1. The effect of microwave power (a), extraction/irradiation time (b), ethanol concentration (c), and liquid-to-solid ratio (d) on the total phenolic yield extracted from Phyllanthus emblica fruits (n = 3)
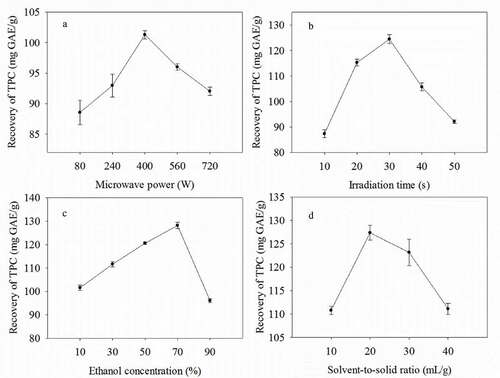
Table 2. Estimated regression coefficients of the quadratic polynomial model and analysis of variance (ANOVA) for the experimental results of total phenolic contents extracted from Phyllanthus emblica fruit using microwave-assisted extraction (MAE) method
Figure 2. Response surface plots of the total phenolic yield extracted from Phyllanthus emblica fruits using microwave-assisted extraction as a function of significant interactions among factors: (a) microwave power and extraction/irradiation time; (b) microwave power and ethanol concentration; (c) microwave power and liquid-to-solid ratio; (d) extraction/irradiation time and ethanol concentration; (e) extraction/irradiation time and liquid-to-solid ratio; and (f) ethanol concentration and liquid-to-solid ratio
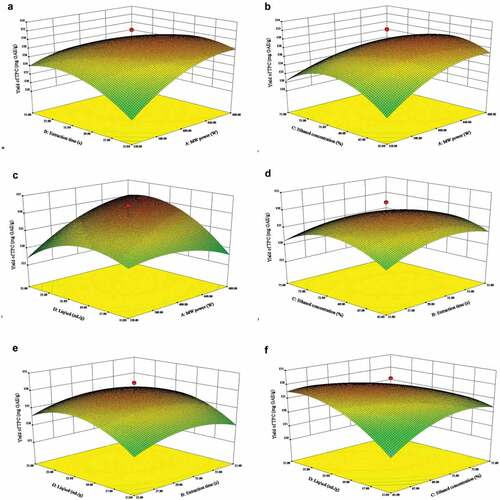
Table 3. The HPLC-ESI-TOF-MS identification and characterization of compounds isolated from Phyllanthus emblica fruit extracts by the optimized MAE method
Figure 3. Total ion current chromatogram of an emblic fruits extracts obtained using the optimized MAE method: (1) mucic acid-1,4-lactone-3-O-gallate, (2) hamamelitannin, (3) isocorilagin, (4) ethyl gallate, (5) methyl gallate, (6) ellagic acid, (7) quercetin-3-O-rhamnoside, and (8) an undefined compound
Table 4. The half maximal inhibitory concentration (IC50, mg/mL) of sample, BHT, and ascorbic acid in antioxidant activities assays
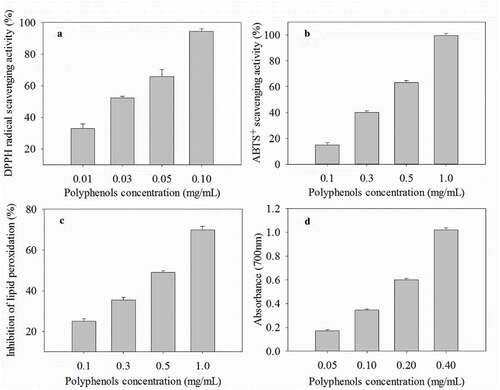
Figure 4. Antioxidant activities of polyphenols of Phyllanthus emblica fruit extracts isolated using the optimized microwave-assisted extraction method. (a) DPPH radical scavenging activity. (b) ABTS+ scavenging activity. (c) Inhibition of lipid peroxidation. (d) Reducing power. Data are represented as means ± SE (n = 3)