Figures & data
Figure 1. Images of (a) water chestnuts, (b) water chestnut kernels, and (c) water chestnut flour
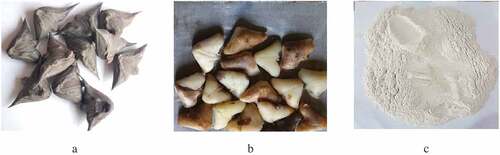
Table 1. Effect of processing condition on flour yield and L*-value
Table 2. Effect of pre-conditioning on resistant starch, glycemic index and glycemic load of water chestnut flour
Figure 2. Response surface plots depicting effects of independent processing variables on dependent variables: (a) Effect of water temperature and water chestnut: water ratio on flour yield. (b) Effect of water chestnut: water ratio and pre-conditioning time on flour yield. (c) Effect of water temperature and pre-conditioning time on flour yield. (d) Effect of water chestnut: water ratio and temperature on L* value of flour. (e) Effect of water chestnut: water ratio and pre-conditioning time on L* value of flour. (f) Effect of water temperature and pre-conditioning time on L* value of flour
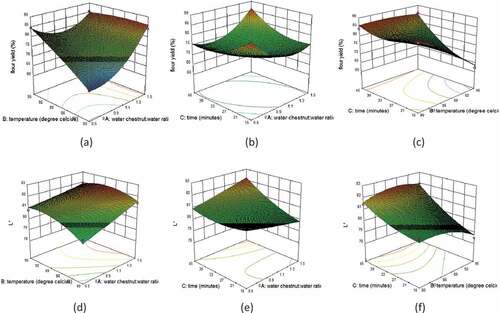
Figure 3. Desirability function response surface plot for preconditioning of water chestnuts
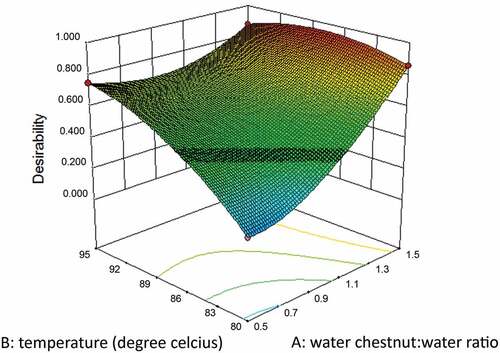
Figure 4. SEM images of (a) flour obtained from water chestnuts subjected to optimized conditions of pre-conditioning and (b) flour obtained from water chestnuts pre-conditioned traditionally
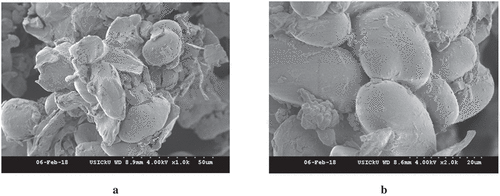
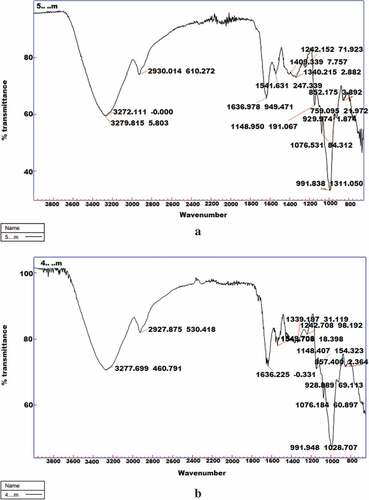
Figure 5. AT-FTIR spectrum of (a) flour obtained from water chestnuts subjected to optimized conditions of pre-conditioning and (b) flour obtained from water chestnuts pre-conditioned traditionally