
Figures & data
Table 1. Percentage of extraction yield from different date varieties
Figure 1. Total phenolic content of different date varieties
Figure 2. Total flavonoid content of different date varieties
Figure 3. DPPH radical scavenging activity of different date varieties
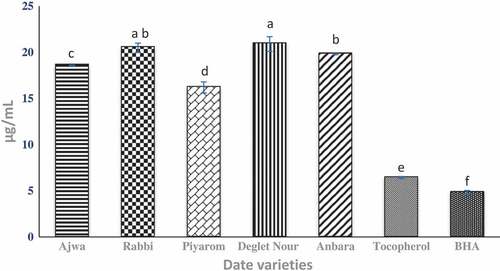
Figure 4. FRAP ferric reducing antioxidant power of different date varieties
Figure 5. ABTS antioxidant capacity of different date varieties
Figure 6. 1H-NMR spectra of different date varieties. (A) Full Spectra of δ 1.0 to 8.5 ppm. (B) Spectra of δ 1.0 to 3.0 ppm. (C) Spectra of δ 3.0 to 6.0 ppm. (D) Spectra of δ 6.0 to 8.0 ppm
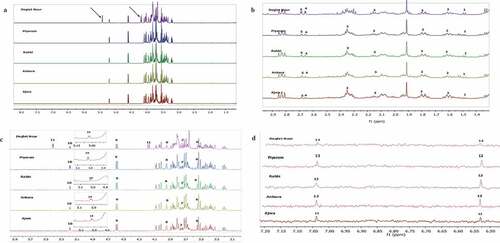
Table 2. Assignments of 1H-NMR spectral signals attained from different date varieties
Figure 7. Analysis for the date spectra obtained using 1H-NMR. (A) PCA (PC1 vs. PC2), (B) PLS-DA score plot, (C) Loading column plots of PC1 and (D) PC2
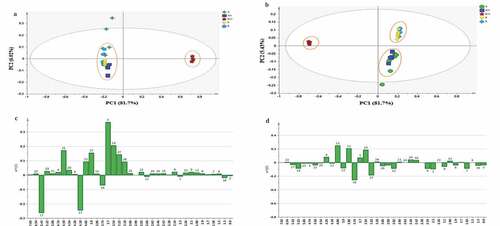
Figure 8. Relative quantities of the metabolites identified in all five varieties of date extracts based on the mean peak area of the 1H-NMR signals
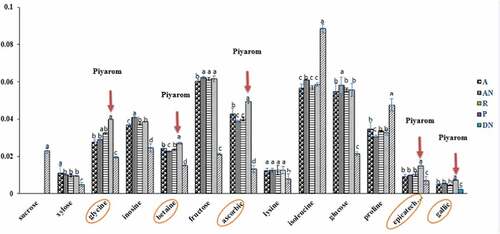
Figure 9. The biplot obtained from PLS describing the relation between the metabolites with antioxidant activities in extract of different date varieties
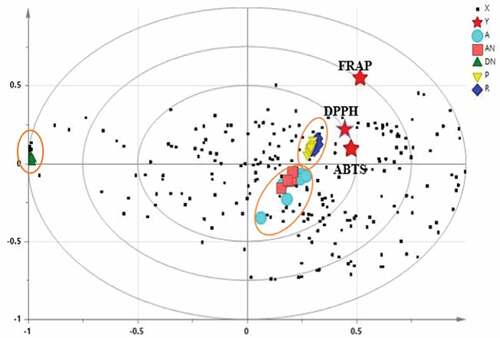
Table 3. VIP values of the major contributing compounds in the PLS