Figures & data
Figure 1. Peracetic acid oxidation change molecular structure of natural SPI to improve surface hydrophobicity and surface activity
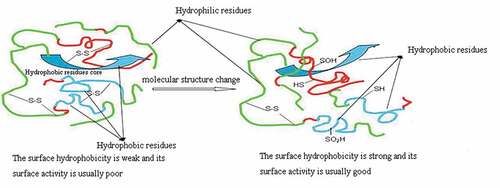
Figure 2. Percentage of disulfide bond cleavage of SPI. The ratios of peracetic acid to SPI are 0, 0.2%, 0.4%, 1%, 1.4%, and 1.8% (v/v), respectively. Different letters on top of a symbol of the line indicate significant (p < 0.05) differences among samples treated under different conditions
Figure 3. Changes of the surface hydrophobicity of SPI (0, 0.2%, 0.4%, 1%, 1.4%, 1.8% of peracetic acid, v/v). Different letters on top of a symbol of the line indicate significant (p < 0.05) differences among samples treated under different conditions
Table 1. γCMC and CMC values for each group of samples
Figure 4. Relationships between surface tension and mass concentration of samples (0, 0.2%, 0.4%, 1%, 1.4%, 1.8% of peracetic acid, v/v)
Figure 5. Foaming capacity and stability of the SPI with different concentrations of peracetic acid (0, 0.2%, 0.4%, 1%, 1.4%, 1.8%, v/v). Different letters on top of a column indicate significant (p < 0.05) differences among samples treated under different conditions
Table 2. Pearson correlation coefficients among surface properties and the surface hydrophobicity of oxidized-SPI
Figure 6. Emulsification capacity and stability of the SPI with different concentrations of peracetic acid (0, 0.2%, 0.4%, 1%, 1.4%, 1.8%, v/v). Different letters on top of a column indicate significant (p < 0.05) differences among samples treated under different conditions
Figure 7. Fluorescence spectra of the oxidized SPI with different concentrations of peracetic acid. The ratios of peracetic acid to SPI are 0, 0.2%, 0.4%, 1%, 1.4%, and 1.8% (v/v), respectively
Table 3. The content of secondary structural conformation of modified SPI with different peracetic acid percent. The results were expressed as mean ±SD of at least three independent observations
Figure 8. CD spectra of the SPI with different concentrations of peracetic acid (0, 0.2%, 0.4%, 1%, 1.4%, 1.8%, v/v)
Figure 9. Particle sizedistribution of the SPI with different concentrations of peracetic acid (0, 0.2%, 0.4%, 1%, 1.4%, 1.8%, v/v)