Figures & data
Figure 8. Relationship of sensory scores with color variation of a* for spoilage detection of pasteurized milk stored at 7°C
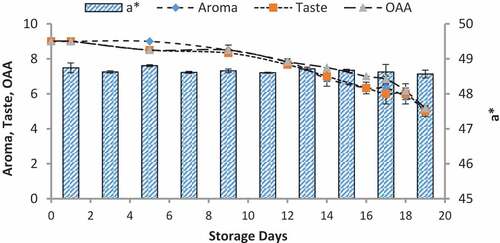
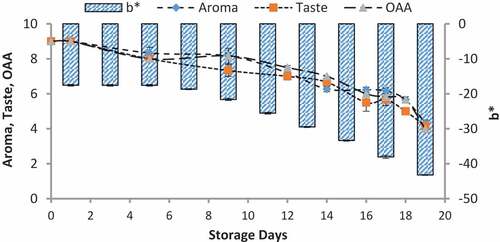
Figure 11. Relationship of sensory scores with color variation of b* for spoilage detection of pasteurized milk stored at 7°C
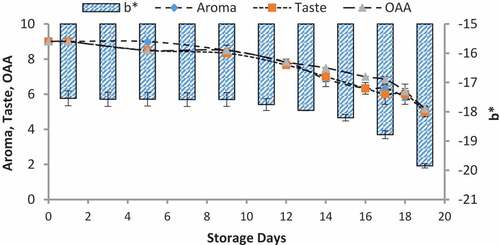
Table 1. Effect of time and temperature on the mean values of pH, acidity, and FFA of pasteurized milk
Table 2. Effect of time and temperature on the means values of fat, protein, and lactose of pasteurized milk
Table 3. Effect of time and temperature on the means score of aroma, taste, and OAA of pasteurized milk
Figure 1. Standard color chart based on L*, a*, and b*
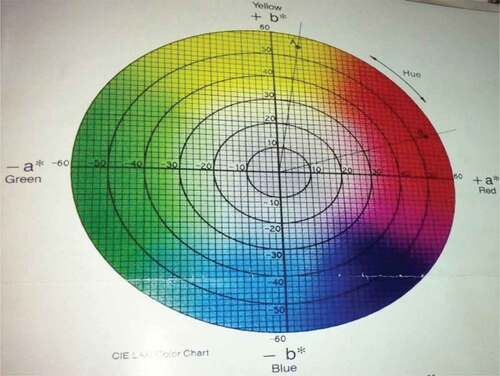
Figure 2. Color of reagent-treated silicon dioxide particles before reaction of volatiles of milk
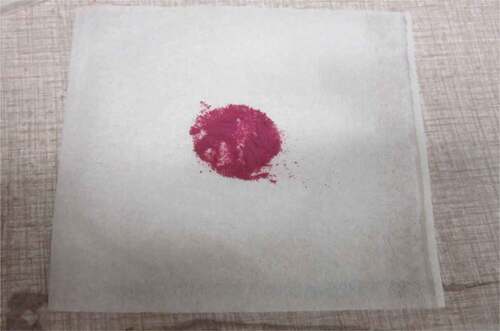
Figure 3. Color of reagent-treated silicon dioxide particles after reaction of volatiles stored at 10°C
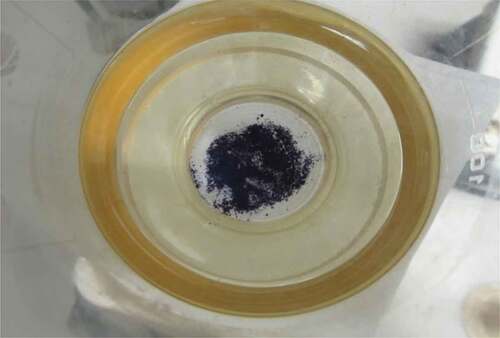
Table 4. Comparison of mean values of nanoparticles color (L*, a*, and b*) produced by volatiles of pasteurized milk stored at different temperatures for 19 days
Table 5. Comparison of mean scores of aroma, taste, and overall acceptability (OAA) of pasteurized milk stored at different temperatures for 19 days
Figure 4. Relationship of sensory scores with color variation of L* for spoilage detection of pasteurized milk stored at 4°C
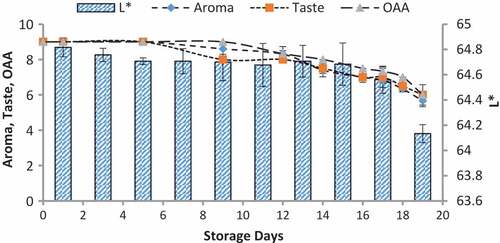
Figure 5. Relationship of sensory scores with color variation of L* for spoilage detection of pasteurized milk stored at 7°C
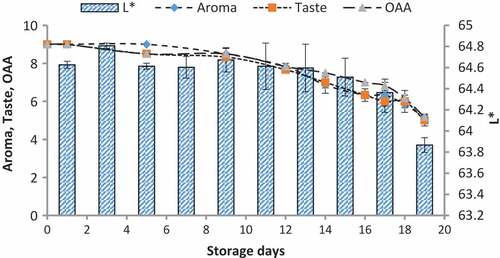
Figure 6. Relationship of sensory scores with color variation of L* for spoilage detection of pasteurized milk stored at 10°C
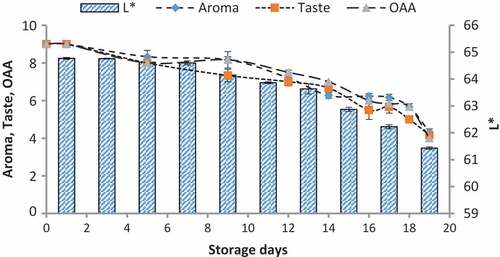
Figure 7. Relationship of sensory scores with color variation of a* for spoilage detection of pasteurized milk stored at 4°C
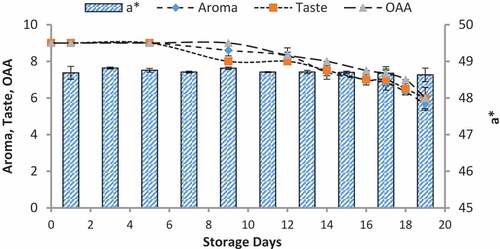
Figure 9. Relationship of sensory scores with color variation of a* for spoilage detection of pasteurized milk stored at 10°C
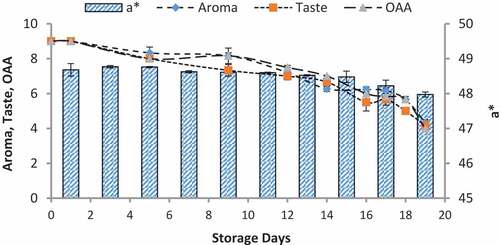
Figure 10. Relationship of sensory scores with color variation of b* for spoilage detection of pasteurized milk stored at 4°C
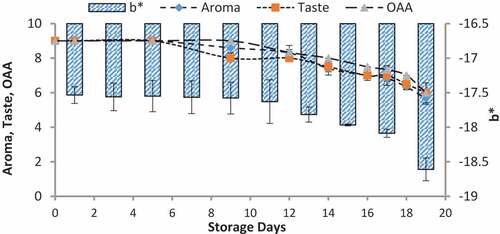
Figure 12. Relationship of sensory scores with color variation of b* for spoilage detection of pasteurized milk stored at 10°C