Figures & data
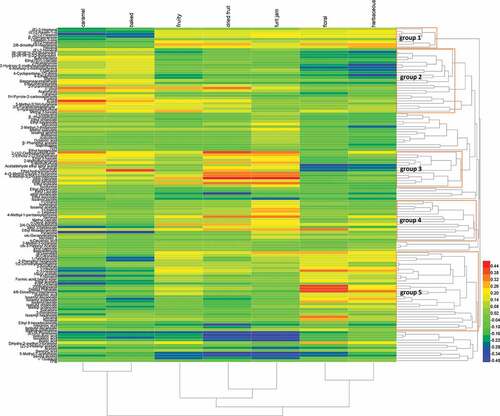
Figure 1. Heatmap of aroma during Msalais wine production
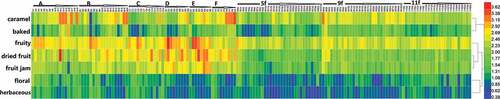
Table 1. Samples collected from Awati Dao Lang Msalais Co., Ltd. in 2016
Table 2. The potential aromatic compounds with maximum OAVs ≥ 0.1
Table 3. Contents of 38 compounds with OAV≥0.1 in the representative samples for Msalais process (μg/L)
Table 4. Contents of 38 compounds with OAV≥0.1 in the representative samples for Msalais process (μg/L)
Figure 2. Evolution of volatile compounds during Msalais wine production based on the normalization data matrix of the determined peak area
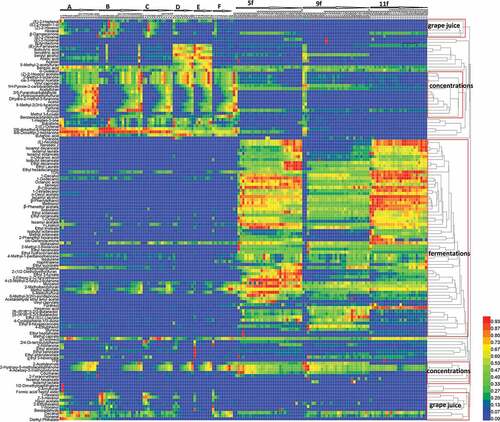
Figure 3. Canonical correlations between sensory characteristics and aromatic compounds