Figures & data
Table 1. Coded and uncoded settings of the process parameters for cottonseed protein hydrolysis, according to a central composite design
Table 2. Central composite design of the independent variables and experimental values of DH (Y1) and ACE inhibitory activity (Y2)
Figure 1. Effects of hydrolysis time (a), temperature (b), pH (c) and E/S ratio (d) on the DH and ACE inhibitory activity of hydrolysate
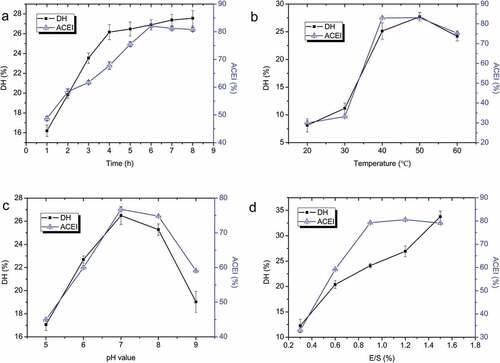
Table 3. Analysis of variance for DH (Y1) and ACE inhibitory activity (Y2)
Figure 2. Response surface three-dimensional plots of the effects of (a, d) temperature and E/S ratio; temperature and pH (b, e); pH and E/S ratio on the DH and ACE inhibitory activity of CPH (c, f)
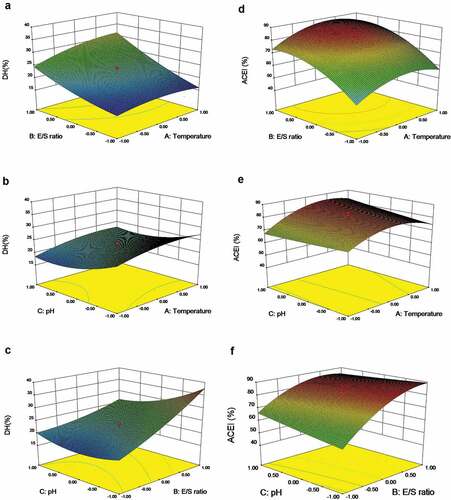
Table 4. ACE inhibitory activity of FII fraction by semi-preparing RP-HPLC
Figure 3. Chromatogram of FII separated by semi-preparing RP-HPLC (a) and of ACE inhibitory activity peptide (FII-2) by analytical RP-HPLC
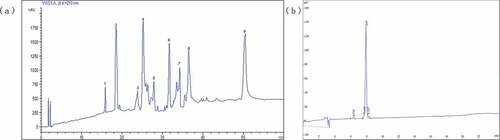
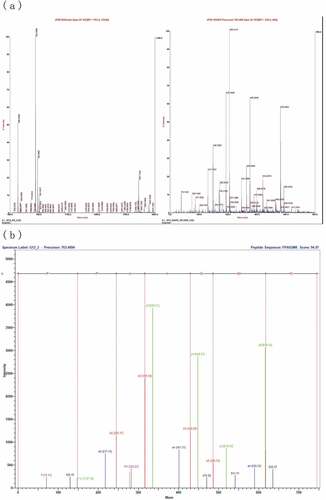
Figure 4. Mass spectrum and analysis of the amino acid sequence of FII-2-p by MALDI-TOF-TOF