Figures & data
Figure 1. Effect of reaction parameters on quercetin content and conversion rate. (a) Reaction time Citation1, (b) Reaction temperature Citation2, (c) Reaction pH Citation3, (d) Addition amount of quercetin Citation4. Citation1 Other reaction conditions: reaction temperature 60°C, pH 6.0, addition amount of quercetin 5% Citation2 Other reaction conditions: reaction time 4 h, pH 6.0, addition amount of quercetin 5% Citation3 Other reaction conditions: reaction time 4 h, reaction temperature 60°C, addition amount of quercetin 5% Citation4 Other reaction conditions: reaction time 4 h, reaction temperature 60°C, pH 6.0
Figure 2. (a) FT-IR and (b) X-ray diffraction spectra of (a) quercetin, (b) amylose, (c) amylose/quercetin physical mixtures and (d) amylose/quercetin complexes (5% w/w)
Figure 3. Citation13C CP/MAS spectra of (a) quercetin, (b) amylose, (c) amylose/quercetin physical mixtures, and (d) amylose/quercetin complexes (5% w/w). Inset in Fig. 3: Citation13C CP/MAS spectra of (c) and (d) in the range of 60–110 ppm (upper left), Citation13C CP/MAS spectra of (a) and (d) in the range of 120-180ppm (lower left)
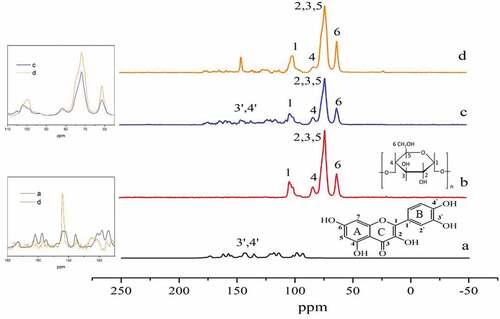
Figure 4. SAXS curves of (a) native cassava starch, (b) amylose and (c) amylose/quercetin complexes
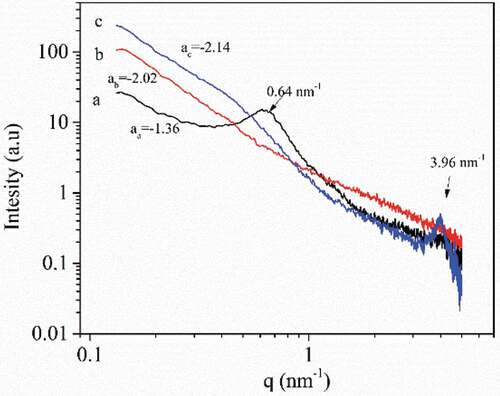
Figure 5. CLSM 3D images of amylose/quercetin complexes (5% w/w) under (a) 488 nm wavelength, (b) 633 nm wavelength and (c) superimposed laser channel
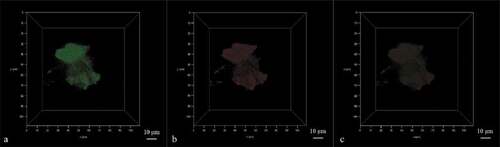
Figure 6. SEM images of (a) quercetin, (b) amylose, (c) amylose/quercetin physical mixtures and (d) amylose/quercetin complexes (5% w/w)
Figure 7. (a) Reaction curves between DPPH• and samples at 25°C. 0.1 ml of each sample was added to 4 ml of DPPH• solution. (b) The scavenging capacity of quercetin and complexes toward DPPH• at 25°C
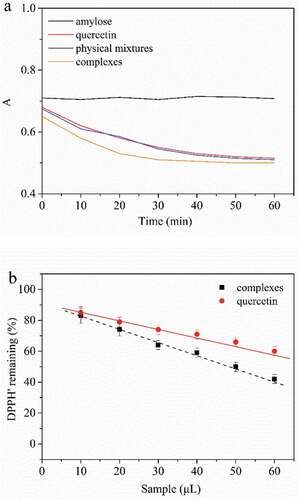
Figure 8. Amount of quercetin released of amylose/quercetin complexes (5% w/w) in simulated stomach and small intestine conditions