
Figures & data
Table 1. Moisture, starch, amylose and damaged starch content of green wheat
Figure 1. Scanning electron microscopy images of green wheat starch granules: a-e. green wheat starch Ⅰ-Ⅴ
Figure 2. X-ray diffraction pattern of five kinds of green wheat starches: a-e. green wheat starch Ⅰ-Ⅴ
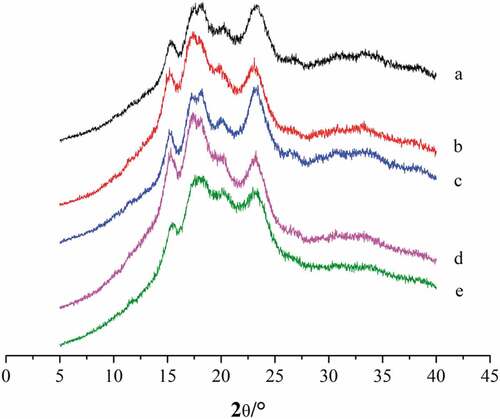
Table 2. Pasting properties of green wheat starches
Table 3. Correlation analysis of the starch, amylose and damaged content, and crystallinity with their pasting properties
Figure 3. TG and DTG curves of green wheat Ⅰ (a) and green wheat starch Ⅰ (b)
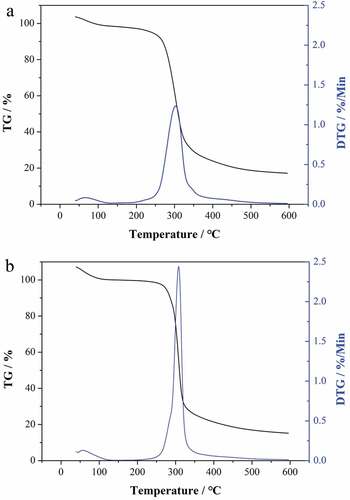
Figure 4. FTIR spectra of green wheat Ⅰ (a) and a:green wheat starch Ⅰ; b:burning green wheat starch Ⅰ at 225°C; c:burning green wheat starch Ⅰ at 375°C (b)
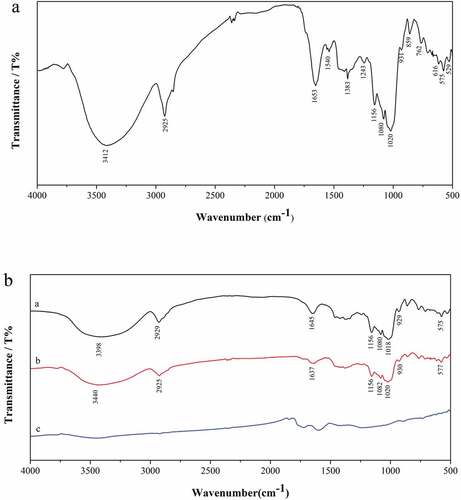
Figure 5. DTG spectra of different proportions of green wheat starch-Al2O3 (a) and TG curves of green wheat starch-Al2O3. a:Al2O3; b-e:20%, 40%, 60%, 80% green wheat starch content of starch-Al2O3; f:green wheat starch (b)
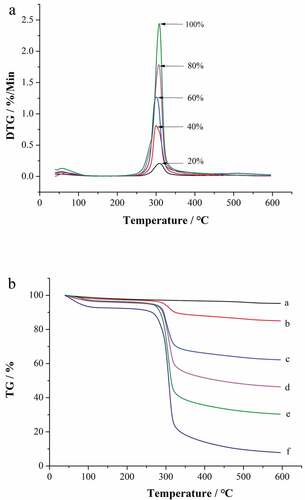
Table 4. Different varieties of green wheat starch content results
Table 5. Five times measurement of green wheat starch I using AACC 76–13 and TG