Figures & data
Figure 1. Appearance quality of the peppers treated with CaCl2, HT, and HT-CaCl2 for 32 days at 8°C
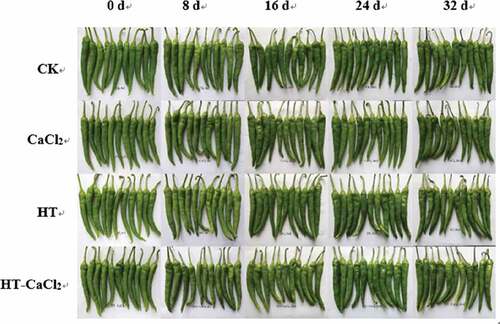
Figure 2. (1) CPMG relaxation decay curves; (2) T2 relaxation time of the peppers treated with CaCl2, HT, and HT-CaCl2 for 32 days at 8°C. A1, B1, C1, D1: CPMG relaxation decay curves; A2, B2, C2, D2: T2 relaxation time; A1, A2: Control; B1, B2: CaCl2; C1, C2: HT; D1, D2: HT-CaCl2.
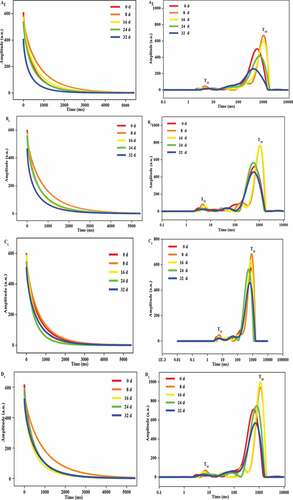
Figure 3. Chlorophyll a and b contents of the peppers treated with CaCl2, HT, and HT-CaCl2 for 32 days at 8°C. Each value is the mean of three replications, and vertical bar represents the standard error of the means (n = 3)
Figure 4. L-ascorbic acid content of the peppers treated with CaCl2, HT, and HT-CaCl2 for 32 days at 8°C. Each value is the mean of three replications, and vertical bar represents the standard error of the means (n = 3)
Figure 5. Total phenol content and antioxidant capacities of the peppers treated with CaCl2, HT, and HT-CaCl2 for 32 days at 8°C. Each value is the mean of three replications, and vertical bar represents the standard error of the means (n = 3)
Figure 6. MDA content of the peppers treated with CaCl2, HT, and HT-CaCl2 for 32 days at 8°C. Each value is the mean of three replications, and vertical bar represents the standard error of the means (n = 3)
Figure 7. POD, PPO, CAT, and PAL activities of the peppers treated with CaCl2, HT, and HT-CaCl2 for 32 days at 8°C. Each value is the mean of three replications, and vertical bar represents the standard error of the means (n = 3)