
Figures & data
Figure 1. Effect of ferrous ion concentration and oxidation duration on the formation of malondialdehyde in Fe2+-vitamin C-induced linoleic acid oxidation model. (a) Ferrous ion concentration and (b) oxidation duration. Data are the mean ± standard deviation of triplicate tests. Different letters represent significant difference in the means at a significant level of 0.05
Figure 2. Effect of (α)-tocopherol on inhibition of linoleic acid oxidation in Fe2+-vitamin C induced linoleic acid oxidation model. Data are the mean ± standard deviation of triplicate tests
Figure 3. Effect of milk oligopeptides and milk oligopeptides with optimal (α)-tocopherol concentration on inhibition of linoleic acid oxidation in Fe2+-vitamin C-induced linoleic acid oxidation model. (a) Malondialdehyde, (b) Peroxide value and (c) Conjugated diene and triene. Data are the mean ± standard deviation of triplicate tests. # represents significant difference between milk oligopeptides, (α)-tocopherol, milk oligopeptide-(α)-tocopherol and the control on the means at a significant level of 0.05. * means significant difference between milk oligopeptides, milk oligopeptide-(α)-tocopherol and (α)-tocopherol on the means at a significant level of 0.05
Figure 4. Effect of (α)-tocopherol on alteration of maximal absorption wavelength of milk oligopeptides in UV-Vis spectra. a→ e represents the concentration of (α)-tocopherol. The concentrations are: a = 0.0 mmol/L, b = 0.05 mmol/L, c = 0.10 mmol/L, d = 0.20 mmol/L, and e = 0.30 mmol/L
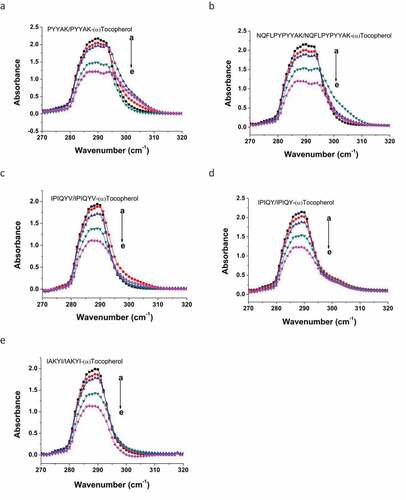
Table 1. Fluorescent quenching constant (Ksv) and quenching rate constant (Kq) of milk oligopeptide-(α)-tocopherol complexes
Figure 5. Effect of (α)-tocopherol on reduction of fluorescent intensity of milk oligopeptides. a→ f represents the concentration of (α)-tocopherol. The concentrations are: a = 0.0 × 10⁻¹⁰ mol/L, b = 0.05 × 10⁻¹⁰ mol/L, c = 0.10 × 10⁻¹⁰ mol/L, d = 0.15 × 10⁻¹⁰ mol/L, e = 0,20 × 10⁻¹⁰ mol/L and f = 0.25 × 10⁻¹⁰ mol/L
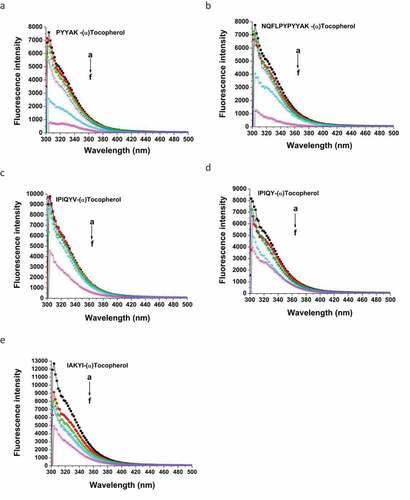
Figure 6. Stern-Volmer fitting curve using milk oligopeptides and (α)-tocopherol. Stern-Volmer formula:
, where F0 and F represent fluorescent intensity of milk oligopeptide before and after the addition of (α)-tocopherol. Kq and Ksv are quenching rate constant and quenching, respectively.
represents the average life span of fluorescent molecule without addition of (α)-tocopherol
Figure 7. Fourier transform infrared spectrum of milk oligopeptides and milk oligopeptide-(α)-tocopherol complexes
Figure 8. Second derivative and curve-fitting analysis of secondary structure of milk oligopeptide and milk oligopeptide-(α)-tocopherol complex using PeakFit 4.12 software
Table 2. Secondary structure percentage in milk oligopeptides and milk oligopeptide-(α)-tocopherol complexes