Figures & data
Figure 1. Test equipment
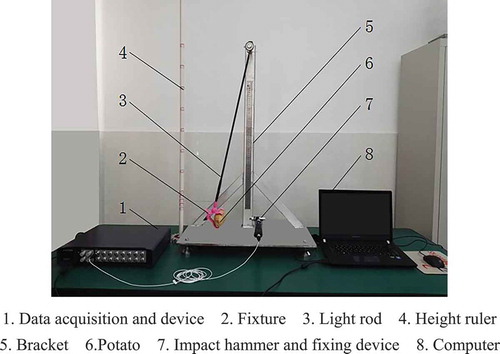
Figure 2. The hammer tips used for the test
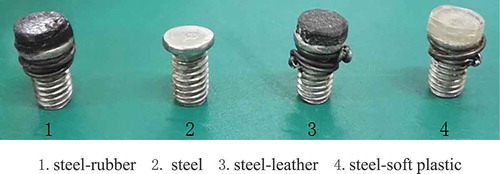
Figure 3. Potato impact force-time curve (where is the loading start time;
is the time of impact peak force;
is the time of the maximum impact displacement;
is the impact end time; Fm is the impact peak force; and
is the impact force of the maximum impact displacement.)
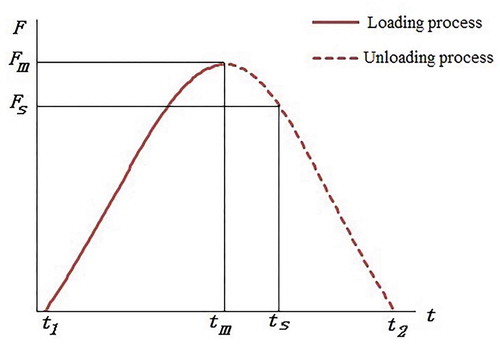
Table 1. Factors and levels
Table 2. Scheme and results of the tests
Table 3. Schemes of the test
Figure 4. Graph of -
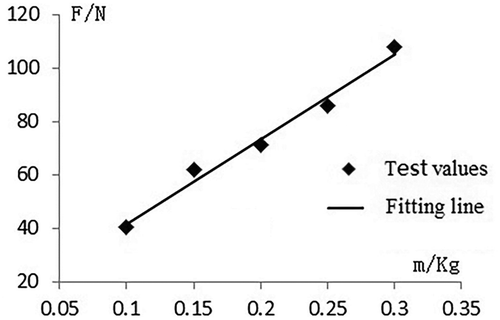
Figure 5. Graph of -
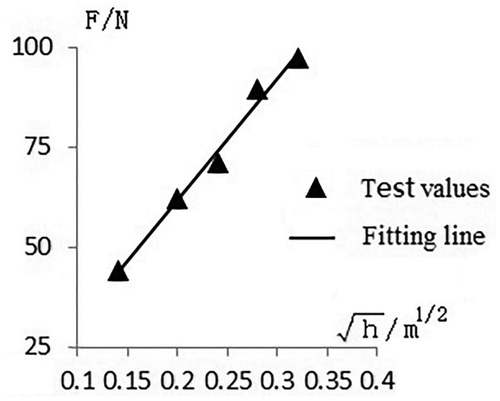
Table 4. Regression analysis of
Figure 6. Graphs of – test number
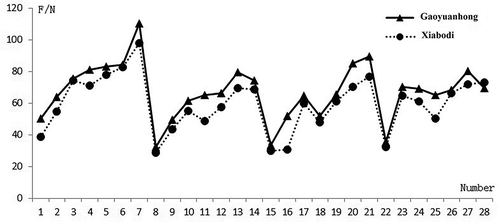
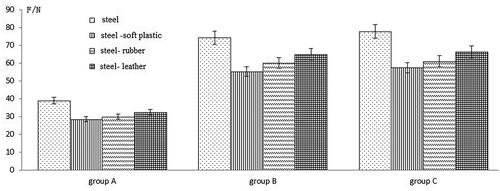
Figure 7. The relationships between and impact materials