Figures & data
Table 1. Fruit quality indices of peach and nectarine.
Figure 1. Appearance characteristics of thinned young and ripe fruit of 7 Chinese peaches and nectarines.
(a): Xiazhizaohong; (b): Ruiguang35; (c): 98-6-54; (d): 98-6-21; (e): 2000-7-1 east; (f): Guibao98-6-48; (g): 94-2-12.
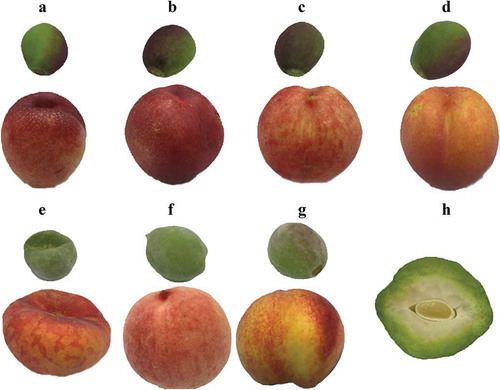
Table 2. Individual polyphenols in thinned and ripe peach and nectarine (mg/kg).
Figure 2. Antioxidant capacity and polyphenol content of peaches and nectarines.
(a): DPPH radical scavenging activity; (b): Ferric reducing antioxidant power (FRAP); (c): ABTS radical scavenging activity; (d): Total polyphenol content (TPC); (e): Total flavonoid content (TFC). Different case letters indicate the significant difference (*P < .05). The names of peach and nectarine varieties are written in .
Table 3. Correlation coefficients between polyphenol, sugar, organic acid, amino acid levels and TPC, TFC and antioxidant capacity.
Figure 3. Heat map visualization of soluble sugar, organic acid and amino acid levels in 7 peach and nectarine varieties.
The content of each component was normalized to complete linkage hierarchical clustering. Sample is in column and component is in row, whereas the green represents undetected. The names of peach and nectarine varieties are written in .
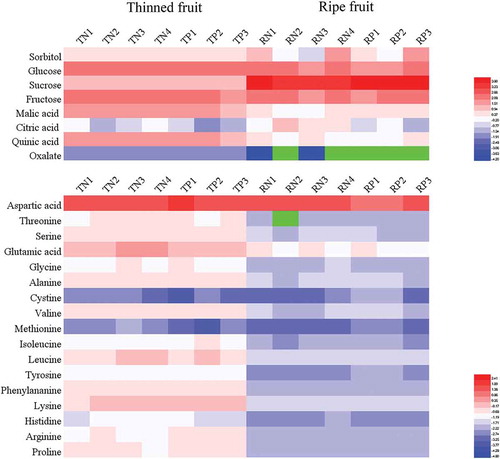
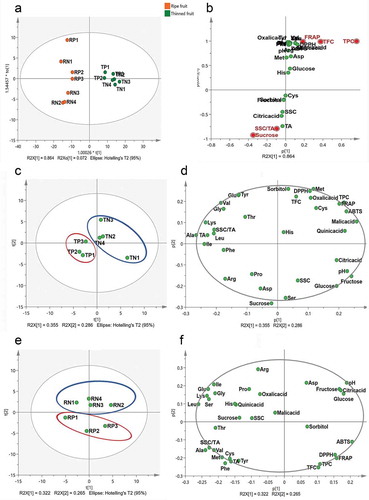
Figure 4. Multivariate OPLS-DA and PCA of the physicochemical characteristics of thinned and ripe fruit of 7 Chinese peach and nectarine varieties.
(a): Scores plot of thinned and ripe fruit (OPLS-DA); (b): S-Plots of thinned and ripe fruit in a separate group (OPLS-DA); (c): Scores Plot of thinned peaches and nectarines (PCA); (d): Loadings plot of thinned peaches and nectarines (PCA); (e): Scores Plot of ripe peaches and nectarines (PCA); (f): Loadings plot of ripe peaches and nectarines (PCA).The names of peach and nectarine varieties are written in . The gray ellipses include 95% of the normal multivariate distribution of the peach (red) and nectarine (blue) samples. In the scores plot, the scores t [1] and t [2] are new variables summarizing the X–variables. In the loadings plot, p [1] vs p [2] displays the relation of the X–variables to each other.