Figures & data
Figure 1. Elution profile of SWP on the G-15. The column was eluted with distilled water at a flow rate of 1.2 mL/min.
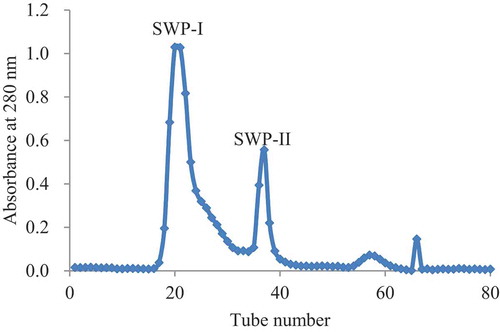
Figure 2. FT-IR spectrum of SWP-I and SWP-II. SWP-I and SWP-II were mixed with KBr powder, ground thoroughly and then pressed into a 1 mm pellet for FT-IR measurement.
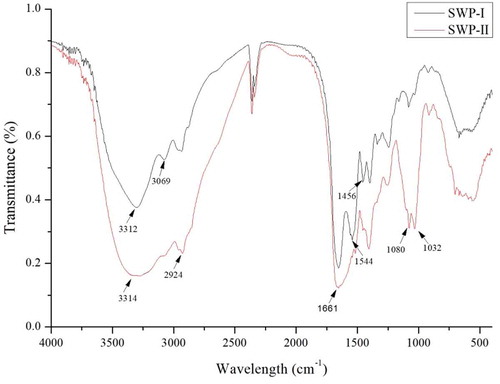
Figure 3. UV light absorption spectrum of SWP-I and SWP-II between 190 nm and 400 nm on a UV spectrophotometer.
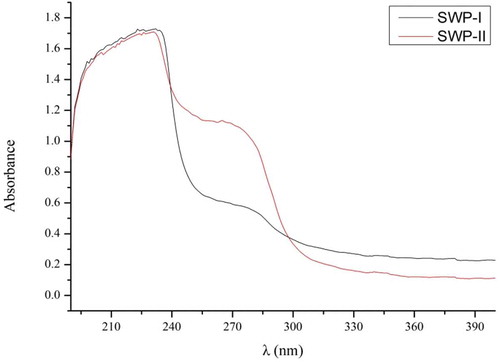
Table 1. Amino acid composition of SWP-I and SWP-II (g/100 g).
Figure 4. GPC spectrum of SWP-I and SWP-II. (A) GPC spectrum of SWP-I (B) GPC spectrum of SWP-II.
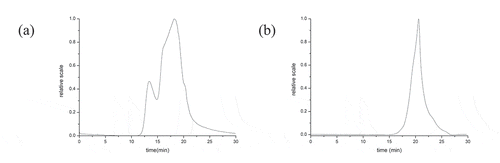
Figure 5. (A) DPPH•, (B) HO•, (C) O2-• scavenging activity, and (D) Fe2+ chelating ability of SWP-I and SWP-II. Data are presented as mean ± SEM n = 3.
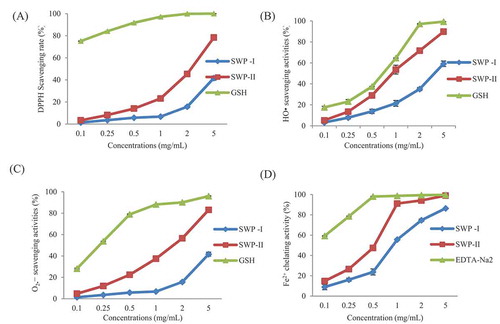
Figure 6. Cell viabilities of H2O2-induced 2BS cells. Data are presented as mean± SEM, n = 4.
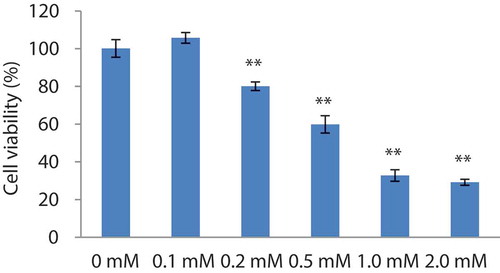
Figure 7. Effects of SWP-I and SWP-II on cell viability. Data are shown as mean± SEM, n = 4. ** p < .01 versus the blank group, ## p < .01 versus the control group.
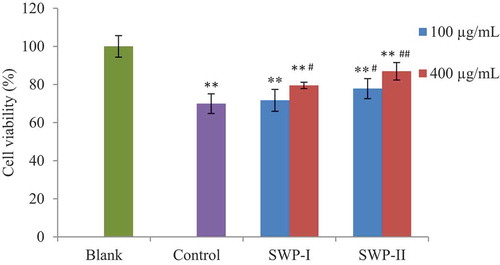
Figure 8. Effects of SWP-I and SWP-II on H2O2-induced ROS generation of 2BS cells. (a) Fluorescence intensities of DCF due to oxidation of DCFH by cellular ROS were detected (Ex = 485 nm, Em = 535 nm). Data are shown as mean± SEM, n = 4. ** p < .01 versus the blank group, ## p < .01 versus the control group. (b) Representative fluorescence images illustrating the increasing fluorescence intensity of DCF produced by ROS in H2O2-treated cells and ROS scavenging abilities of the two fractions.
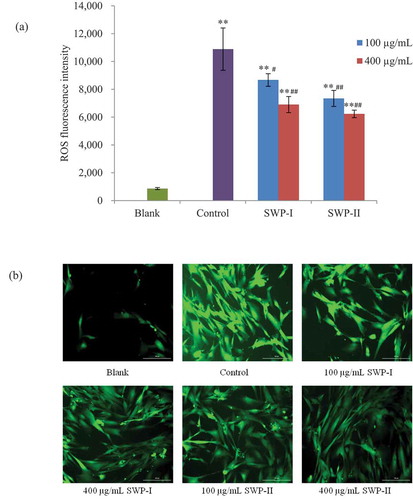
Figure 9. Inhibitory effects of SWP-I and SWP-II on oxidative stress-induced premature senescence in 2BS cells. (a) The ratios of SA-β-gal positive cells were assessed using a paired T-test. Data are shown as mean± SEM, n = 4. ** p < .01 versus the blank group, ## p < .01 versus the control group. (b) Morphological changes of 2BS cells after staining with SA-β- Gal were observed by optical microscopy. Magnification: 100 ×.
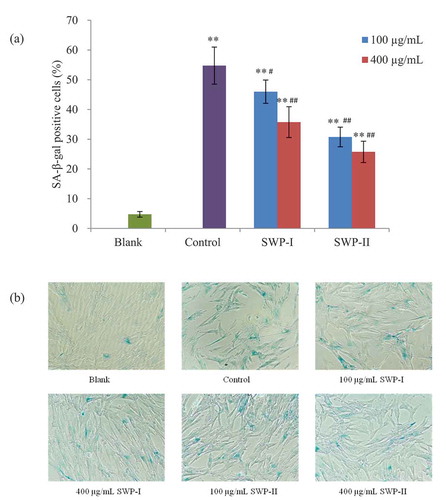
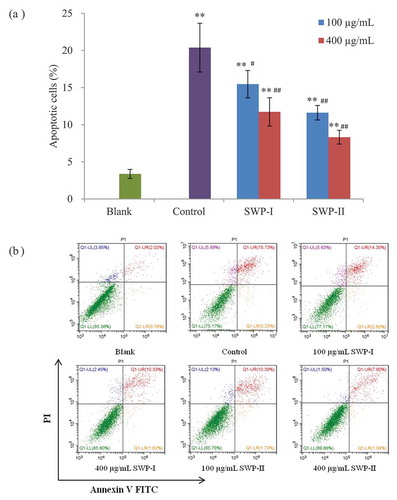
Figure 10. Protective effects of SWP-I and SWP-II on H2O2-induced cell apoptosis. (a) Cell apoptosis rates of 2BS were assessed by annexin V and PI double staining and flow cytometry. Data are shown as mean± SEM, n = 4. ** p < .01 versus the blank group, ## p < .01 versus the control group. (b) Scatter diagram of cell apoptosis by flow cytometry.