Figures & data
Figure 1. The flow diagram of study selection.
*The work of Huang et al. was divided into two different studies.
Table 1. Characteristics of included trials.
Table 2. Subgroup analysis to assess the effect of probiotic consumption on lipid inflammatory markers.
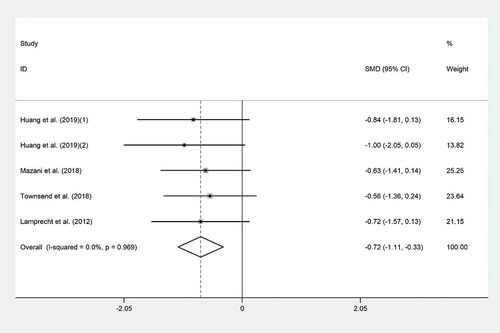
Figure 2. Forest plot of the effect of probiotic consumption on IFN-γ.
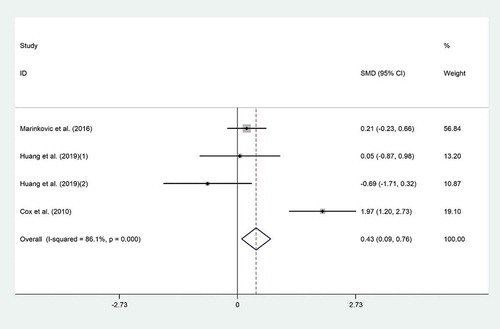
Figure 3. Forest plot of the effect of probiotic consumption on IL-6.
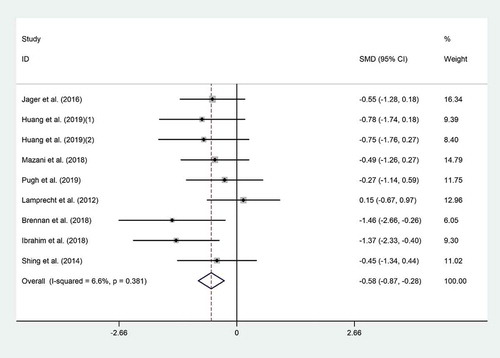
Figure 4. Forest plot of the effect of probiotic consumption on IL-8.
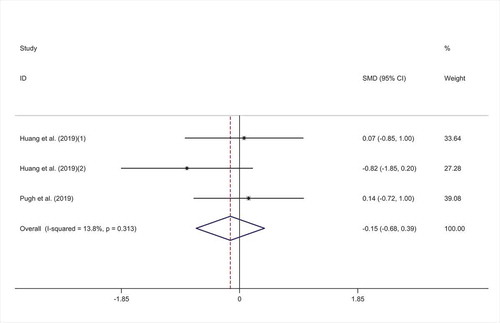
Figure 5. Forest plot of the effect of probiotic consumption on IL-10.
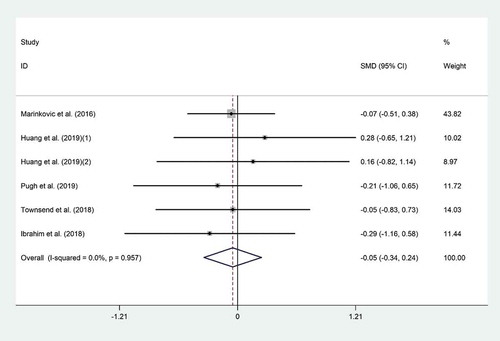
Figure 6. Forest plot of the effect of probiotic consumption on TNF-α.