
Figures & data
Table 1. Physicochemical parameters of goat milk and oat flour used in goat milk yogurt formulations
Figure 1. pH profile during fermentation of goat milk yogurt with added oat flour. Y0, Y1, Y2, and Y3: goat milk yogurt with 0, 1, 2, and 3% oat flour added
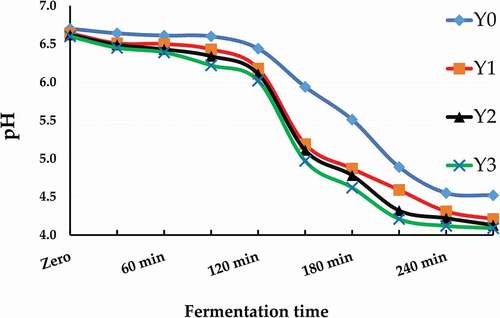
Table 2. pH values and viable cell counts (log CFU/g) of lactic acid bacteria in goat milk yogurt with added oat flour
Figure 2. Syneresis values (%) of goat milk yogurt with added oat flour during cold storage. Y0, Y1, Y2, and Y3: goat milk yogurt with 0, 1, 2, and 3% oat flour added. Values are mean ± SD of three independent replicates. Column charts with different letters are significantly different (p < 0.05)
Table 3. Texture properties of goat milk yogurt with added oat flour
Table 4. Total phenolic content (TPC, mg GAE/g) in undigested and digested goat milk yogurt with added oat flour
Table 5. DPPH• inhibition (%) in undigested and digested goat milk yogurt with added oat flour
Table 6. Sensory properties of goat milk yogurt with added oat flour