
Figures & data
Table 1. Actual and coded values of variables
Table 2. Coded central composite design with the responses
Table 3. Models used to describe the drying curves of R. pimpinellifolia.
Table 4. Models used to describe the rehydration kinetics of R. pimpinellifolia.
Table 5. Physical and chemical characteristics of fresh R. pimpinellifolia fruits
Figure 1. Effect temperature and air velocity on drying time
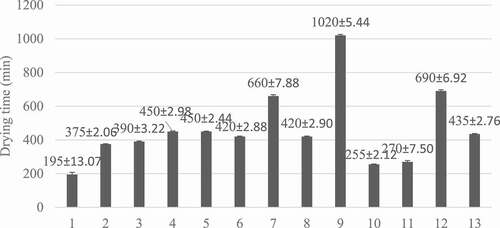
Figure 2. Effect temperature and air velocity on total color change
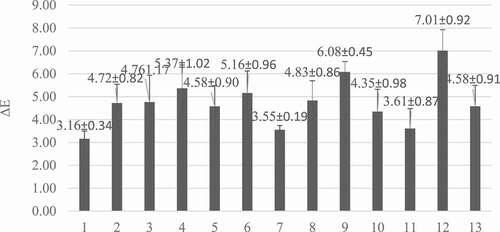
Figure 3. 3D graphics showing the effect of independent variables on the responses
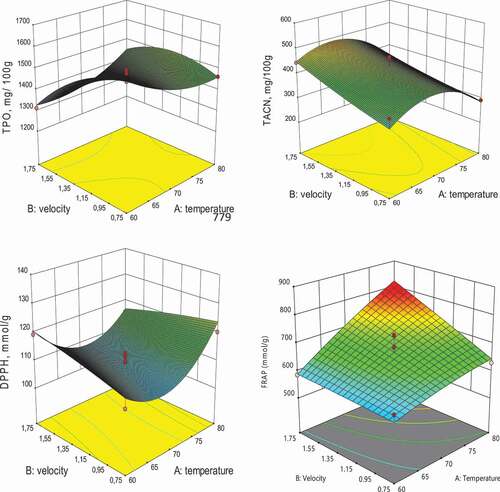
Table 6. Results of statistical analysis of the thirteen selected drying models applied to experimental drying data of R. pimpinellifolia fruits
Figure 4. Perturbation plot showing the effects of variables on total anthocyanin
Figure 5. Moisture content versus time for drying curve of R. pimpinellifolia fruits at 67. 21°C; 1.75 m.s−1
Table 7. Textural and shrinkage characteristics
Figure 6. Microstructures of fresh (a) and dried (b) dried R. pimpinellifolia.
Figure 7. Rehydration behavior of dried R. pimpinellifolia fruits at 20, 40 and 60°C
Table 8. Results of statistical analysis of the modeling of rehydration data
Table 9. LC/MS/MS quantification of phenolic compounds identified in fresh and dried fruit (ppm)