Figures & data
Table 1. Different blends of sunflower oil using D-optimal mixture design along with response variables
Figure 1. Response surface plots representing changes in free fatty acid (a), peroxide value (b) and iodine value (c).
Table 2. Physicochemical analysis of best oil blend after multiple frying
Figure 2. Raw (a) and standard normal variate preprocessed (b) FT-IR spectra for multiple frying.
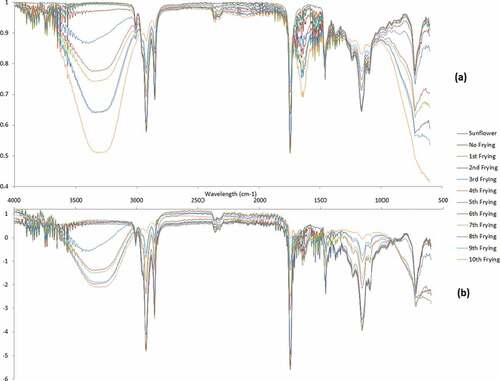
Figure 3. PCA score plot (a) and loadings (b) for multiple frying.
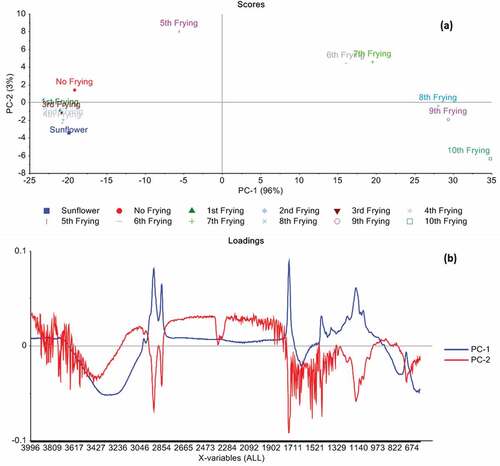
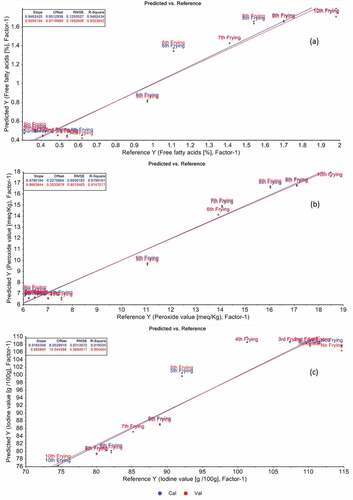
Figure 4. PLSR prediction models for in free fatty acid (a), peroxide value (b) and iodine value (c).