
Figures & data
Table 1. Size and encapsulation efficiency encapsulated cells. Size of cells shown with ± standard deviation. Values are expressed as means (n = 3) followed by the same lower-case letters on the columns differ significantly by LSD at 5% probability.
Figure 1. Viability of un-encapsulated and encapsulated (sodium alginate, sodium alginate + inulin) probiotic microgels under simulated gastric fluid conditions during storage intervals (0, 30, 60, 90, and 120 minutes) compared with control. Each line represents mean value for viability of treatments. T1 (un-encapsulated probiotics), T2 (L. acidophilus encapsulated with sodium alginate) and T3 (L. acidophilus encapsulated with sodium alginate+inulin).
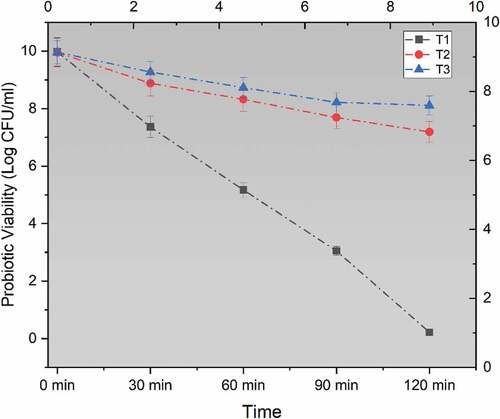
Figure 2. Viability of un-encapsulated and encapsulated (sodium alginate, sodium alginate + inulin) probiotic microgels in simulated intestinal fluid environment during storage intervals (0, 30, 60, 90, and 120 minutes) compared with control. Each line represents mean value for viability of treatments. T1 (un-encapsulated probiotics), T2 (L. acidophilus encapsulated with sodium alginate) and T3 (L. acidophilus encapsulated with sodium alginate+inulin).
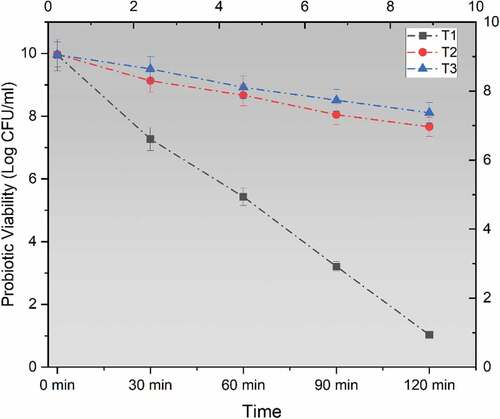
Table 2. Effect of pH on different probiotic yogurt treatments. Values are expressed as means (n = 3) with ± standard deviation followed by the same lower-case letters on the columns that differ significantly by LSD at 5% probability.
Figure 3. Effect of free (unencapsulated) and encapsulated (sodium alginate, sodium alginate + inulin) L. acidophilus on probiotic viability in Yogurt during storage intervals (0, 5, 10, and 15 days) compared with control. Each line represents mean value for viability of treatments. Y0 (control/ without L. acidophilus), Y1 (yogurt with free probiotics), Y2 (Yogurt having L. plantarum encapsulated with sodium alginate) and Y3 (Yogurt containing L. plantarum encapsulated with sodium alginate+inulin).
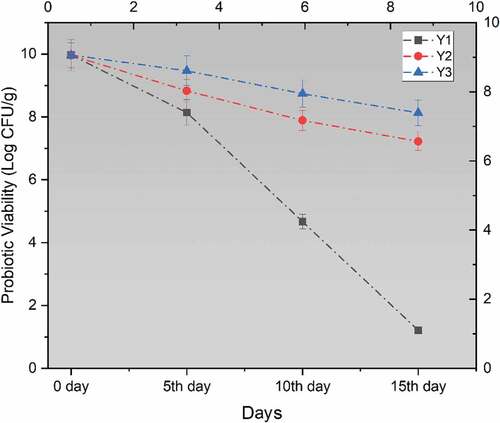
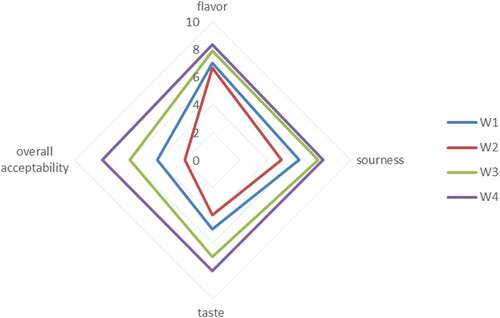
Figure 4. Effect of free (unencapsulated) and encapsulated (sodium alginate, sodium alginate + inulin) L. acidophilus on the sensory profile in Yogurt during storage intervals (0, 5, 10, and 15 days) compared with control. Each line represents mean value for viability of treatments. Y0 (control/ without L. acidophilus), Y1 (yogurt with free probiotics), Y2 (Yogurt having L. plantarum encapsulated with sodium alginate) and Y3 (Yogurt containing L. plantarum encapsulated with sodium alginate+inulin).
Data availability statement
The data that support the findings of this study are available from the corresponding author, upon request.