Figures & data
Table 1. Study plan for adulteration of vegetable oil in butter.
Table 2. AST and color test results of butter with different levels of vegetable oil adulteration.
Figure 1. Typical FTIR spectra for butter (100%), vegetable oil (100%), and adulterated butter samples with different levels of vegetable oil.
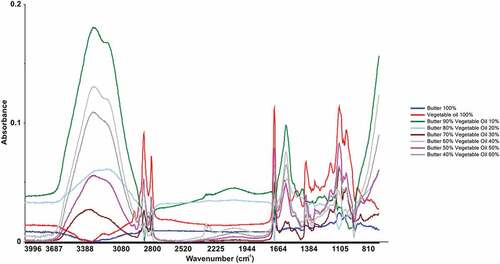
Figure 2. Hostelling’s T2 map for FTIR spectra of butter, vegetable oil, and adulterated samples.
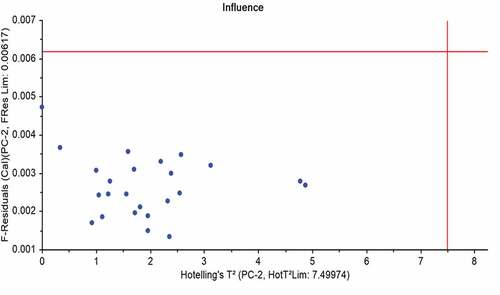
Figure 3. PCA similarity map defined by PC1 and PC2 for the FTIR spectra of butter, vegetable oil, and adulterated samples (VO: Vegetable Oil, B: Butter).
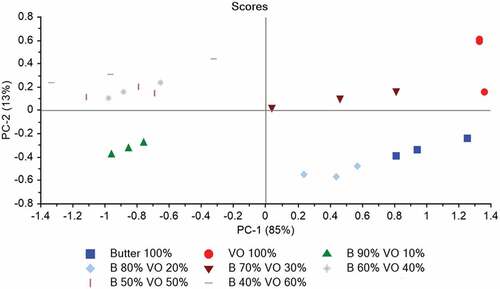
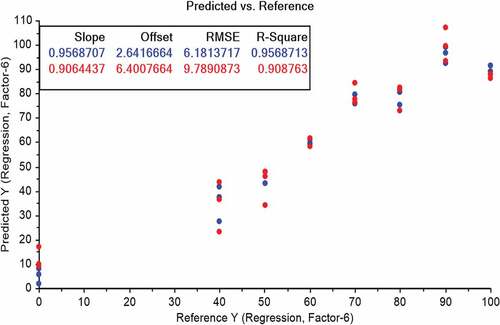
Figure 4. PLS regression-based prediction model developed by FTIR spectra (4000–800 cm−1) obtained from butter, vegetable oil, and adulterated samples.
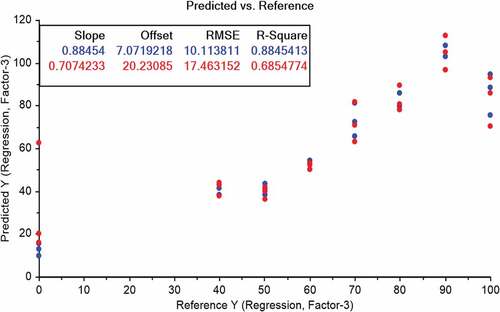
Figure 5. PLS regression analysis of FTIR spectra (3000–2800 cm−1) obtained from butter, vegetable oil and adulterated samples.