
Figures & data
Figure 1. Egg visible/near infrared spectrum acquisition device.
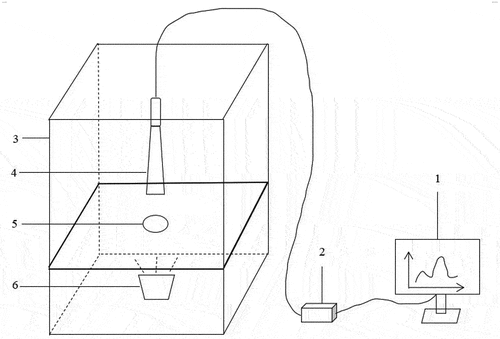
Table 1. Total variance explained.
Table 2. Component matrix after rotation a.
Table 3. Egg indicator weights based on principal component analysis.
Figure 2. Changing trend of IFI with storage time.
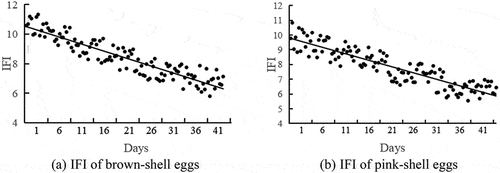
Table 4. Descriptive statistical analysis of the IFI of the sample set.
Figure 3. The raw spectral of brown-shell eggs and pink-shell eggs.
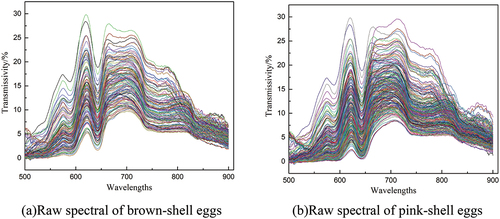
Table 5. Full-spectrum model prediction performance of IFI with different pre-processing methods.
Figure 4. Screening characteristic wavelengths by competitive adaptive reweighted sampling algorithm.
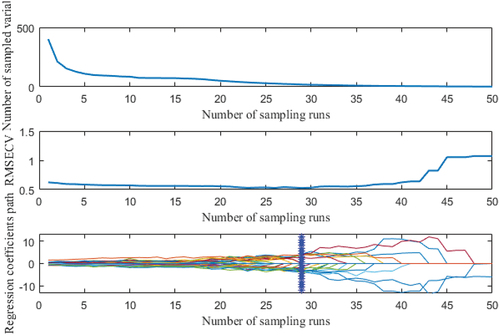
Figure 5. Screening characteristic wavelengths by shuffled frog leaping algorithm.
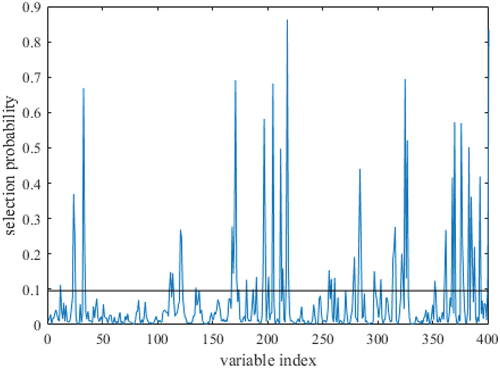
Figure 6. Correlation between measured and predicted values of IFI in calibration set and validation set.
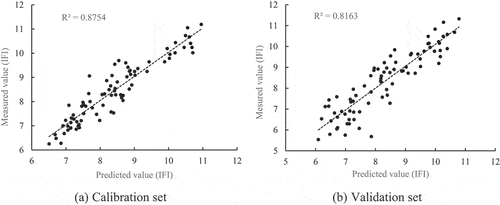
Table 6. Evaluation results of the prediction model based on the characteristic wavelength.