
Figures & data
Figure 1. The schematic overview of the experimental program, showing the key stages, from the procurement of pork neck meat samples, preparation of marinade variants, through oven-grilling activity, subsequently analytical measurements. ABTS = 2,2’-Azinobis-(3-ethylbenzthiazoline-6-sulfonate); DPPH = 1,1-diphenyl-2-pierylhydrazy (radical scavenging activity); FRAP = ferric reducing antioxidant power; UPWr = Uniwersytet Przyrodniczy we Wrocławiu (Wroclaw University of Environmental and Life Sciences-Poland).
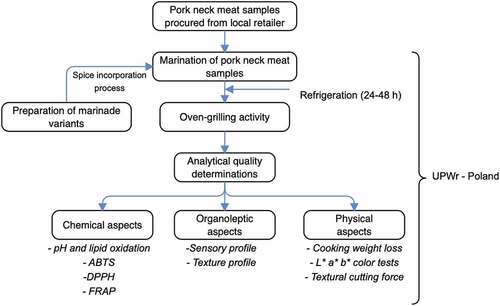
Figure 2. Changes in pH across the various marinated pork neck meat meat samples before and after oven-grilling. The different letters represent as follows: (a) = CP before oven-grill; (b) = CP after oven-grill; (c) = GP before oven-grill; (d) = GP after oven-grill; (e) = BS before oven-grill; (f) = BS after oven-grill; The number representations for different color shades are as follows: 1) control (antioxidant additive % = 0.0); 2) control (antioxidant additive % = 0.5); 3) control (antioxidant additive % = 1.0); 4) control (antioxidant additive % = 1.5); 5) AS (antioxidant additive % = 0.0); 6) AS (antioxidant additive % = 0.5); 7) AS (antioxidant additive % = 1.0); 8) AS (antioxidant additive % = 1.5); 9) IM (antioxidant additive % = 0.0); 10) IM (antioxidant additive % = 0.5); 11) IM (antioxidant additive % = 1.0); 12) IM (antioxidant additive % = 1.5). Cranberry pomace = CP; Grape pomace = GP; BS = Baikal Skullcap; African spice = AS; Industrial marinade/pickle = IM.
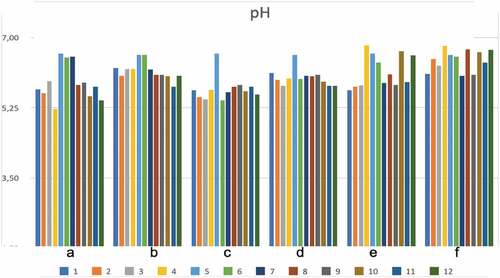
Figure 3. Variation of pH by difference across the various marinated oven-grilled pork neck meat samples compared to control. The number representations are as follows: 1) control (antioxidant additive % = 0.0); 2) control (antioxidant additive % = 0.5); 3) control (antioxidant additive % = 1.0); 4) control (antioxidant additive % = 1.5); 5) AS (antioxidant additive % = 0.0); 6) AS (antioxidant additive % = 0.5); 7) AS (antioxidant additive % = 1.0); 8) AS (antioxidant additive % = 1.5); 9) IM (antioxidant additive % = 0.0); 10) IM (antioxidant additive % = 0.5); 11) IM (antioxidant additive % = 1.0); 12) IM (antioxidant additive % = 1.5). African spice = AS; Industrial marinade/pickle = IM.
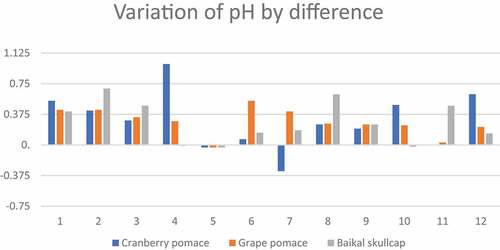
Figure 4. Changes in (a)ABTS (b) DPPH and (c)FRAP across the various marinated oven-grilled pork neck meat meat samples compared to control. Error bars show mean ± standard deviation (SD). ABTS = 2,2’-Azinobis-(3-ethylbenzthiazoline-6-sulfonate; DPPH = 1,1-diphenyl-2-pierylhydrazy (radical scavenging activity); FRAP = ferric reducing antioxidant power; Error bars shows mean values ± standard deviation (SD). African spice = AS; Industrial marinade/pickle = IM; CP = Cranberry pomace; GP = Grape pomace; BS = Baikal Skullcap.
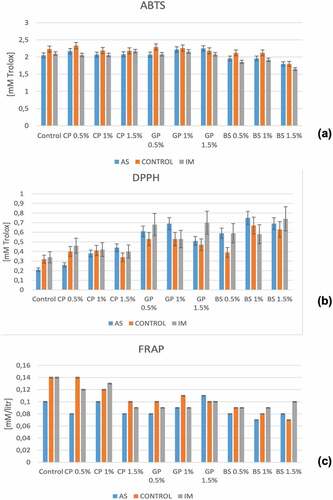
Table 1. Changes in thiobarbituric acid reactive substance (TBARS) across the various marinated oven-grilled pork neck meat samples compared to control.
Figure 5. Changes in L*a*b* color of (a) cranberry pomace, (b) grape pomace, and (c) Baikal skullcap, across the various marinated oven-grilled pork neck meat samples. The number representations for different color shades are as follows: 1) control (antioxidant additive % = 0.0); 2) control (antioxidant additive % = 0.5); 3) control (antioxidant additive % = 1.0); 4) control (antioxidant additive % = 1.5); 5) AS (antioxidant additive % = 0.0); 6) AS (antioxidant additive % = 0.5); 7) AS (antioxidant additive % = 1.0); 8) AS (antioxidant additive % = 1.5); 9) IM (antioxidant additive % = 0.0); 10) IM (antioxidant additive % = 0.5); 11) IM (antioxidant additive % = 1.0); 12) IM (antioxidant additive % = 1.5). African spice = AS; Industrial marinade/pickle = IM.
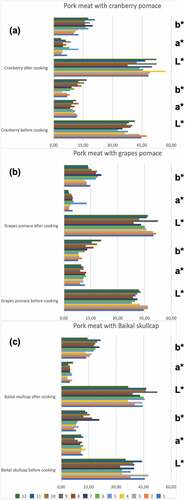
Figure 6. Changes in cooking weight loss (%) across the various marinated oven-grilled pork neck meat samples. The number representations for different color shades are as follows: 1) control (antioxidant additive % = 0.0); 2) control (antioxidant additive % = 0.5); 3) control (antioxidant additive % = 1.0); 4) control (antioxidant additive % = 1.5); 5) AS (antioxidant additive % = 0.0); 6) AS (antioxidant additive % = 0.5); 7) AS (antioxidant additive % = 1.0); 8) AS (antioxidant additive % = 1.5); 9) IM (antioxidant additive % = 0.0); 10) IM (antioxidant additive % = 0.5); 11) IM (antioxidant additive % = 1.0); 12) IM (antioxidant additive % = 1.5). African spice = AS; Industrial marinade/pickle = IM.
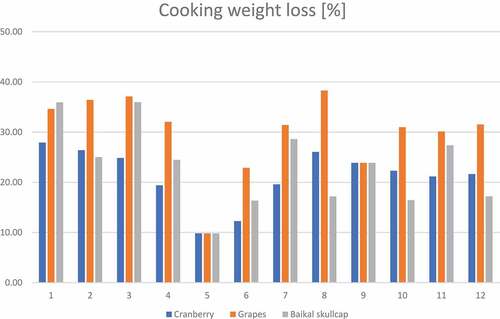
Table 2. Changes in textural cutting force across the various marinated grilled pork neck meat samples compared to control.
Table 3. Sensory profile by way of flavour, appearance, tenderness, taste and off-flavour across the various marinated grilled pork neck meat samples compared to control.
Table 4. Textural profile by way of hardness, chewiness, gumminess, graininess, and greasiness across the various marinated grilled pork neck meat samples compared to control.
Data availability statement
The datasets generated during and/or analyzed can be made available upon reasonable request from the corresponding authors.