Figures & data
Figure 1. The dependence of the true strain rate on the engineering strain for white chocolate.
Table 1. Acoustical properties of the tested chocolates.
Table 2. Elastic properties of the tested chocolates.
Figure 2. Example of the stress-strain curve for white chocolate. The difference between engineering and true stress strain dependences is shown in the upper part of the figure. The lower part shows the loading history of the specimen in the space strain-strain rate – stress.
Figure 3. (a.) Stress-strain curves at loading rate 1mm/min, (b.) Stress-strain curves at loading rate 10mm/min, (c.) Stress-strain curves at loading rate 100mm/min.
Figure 4. Effect of loading rate on the extent of the first region of the stress-strain curve.
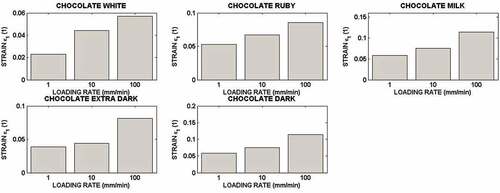
Table 3. Parameters of linear function describing the engineering stress vs engineering strain dependence in the first region.
Table 4. Parameters of linear function describing the true stress vs true strain dependence in the first region.
Figure 5. Parameters of non linear function describing the dependence true stress vs true strain in the second region.
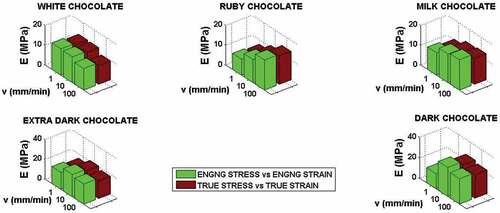
Figure 6. Parameters of linear function describing the engineering stress vs engineering strain dependence in the second region.
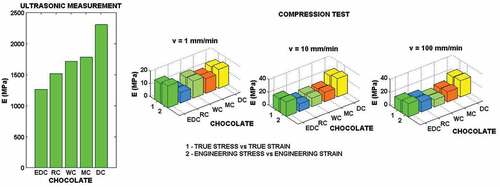
Figure 7. (a.) Effect of the loading rate on the stress vs strain dependence – engineering approach, (b.) Effect of the loading rate on the stress vs strain dependence – true values of stress and strain.
Figure 8. Example of linear fit of engineering stress vs engineering strain.
Table 5. Best fittings parameters of EquationEquation (13)(13)
(13) and determination coefficients (R2) for true stress – true strain.
Table 6. Best fittings parameters of EquationEquation (11)(11)
(11) in the region
and determination coefficients (R2). Engineering stress-Engineering strain.
Figure 9. Stress vs strain rate for different values of strain.