Figures & data
Table 1. Primers for real-time q-PCR analysis.
Figure 1. CI index (a) and relative electrolyte leakage (b) in cold stored cucumber fruit. Cucumber fruits were subjected to NO donor SNP (1.0 μM) or water (control). Data presented are mean values ± SD (n = 3). The asterisk denotes statistically significant differences between the treatment and control groups at each time point (*P < .05).
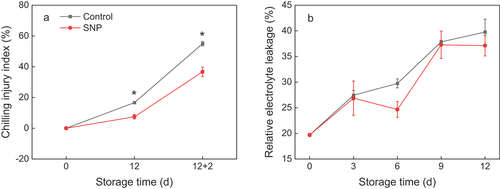
Figure 2. The activities of phospholipase A (PLA) (a), phospholipase D (PLD) (b), lipase (c), and lipoxygenase (LOX) (d) in cold stored cucumber fruit. Cucumber fruits were subjected to NO donor SNP (1.0 μM) or water (control). Data presented are mean values ± SD (n = 3). The asterisk denotes statistically significant differences between the treatment and control groups at each time point (*P < .05).
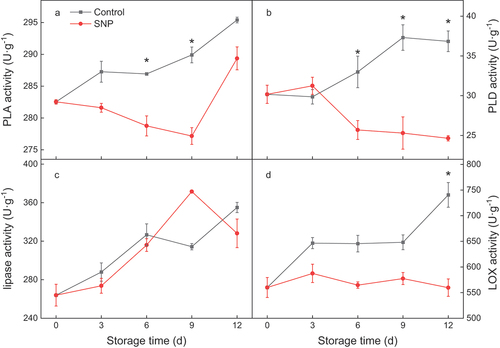
Figure 3. The relative expression of CsPLA (a), CsPLD (b), CsLipase (c), and CsLOX (d) in cold stored cucumber fruit. Cucumber fruits were subjected to NO donor SNP (1.0 μM) or water (control). Data presented are mean values ± SD (n = 3). The asterisk denotes statistically significant differences between the treatment and control groups at each time point (*P < .05, **P < .01).
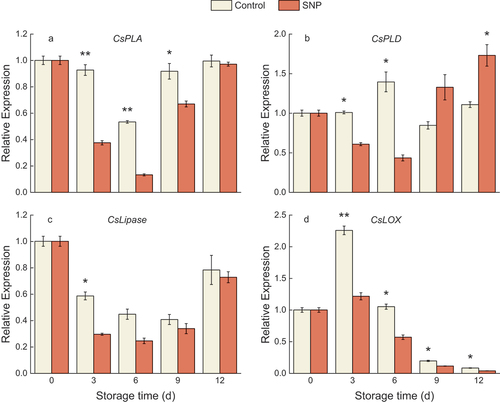
Figure 4. Adenosine triphosphate (ATP) (a), adenosine diphosphate (ADP) (b) and adenosine monophosphate (AMP) content (c), and energy charge (EC) (d) in cold stored cucumber fruit. Cucumber fruits were subjected to NO donor SNP (1.0 μM) or water (control). Data presented are mean values ± SD (n = 3). The asterisk denotes statistically significant differences between the treatment and control groups at each time point (*P < .05, **P < .01).
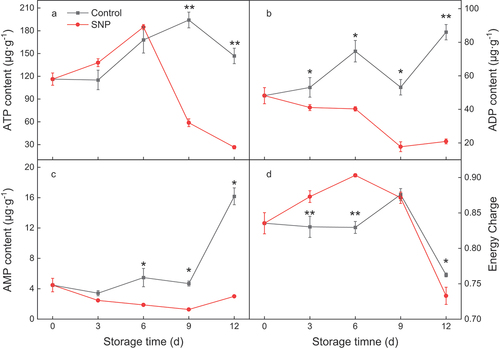
Figure 5. The activities of H+-ATPase (a), Ca2+-ATPase (b), succinate dehydrogenase (SDH) (c), and cytochrome C oxidase (CCO) (d) in cold stored cucumber fruit. Cucumber fruits were subjected to NO donor SNP (1.0 μM) or water (control). Data presented are mean values ± SD (n = 3). The asterisk denotes statistically significant differences between the treatment and control groups at each time point (*P < .05, **P < .01).
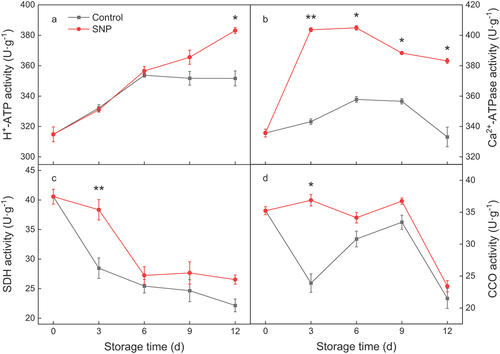
Figure 6. The relative expression of CsH+-ATPase (a), CsCa2+-ATPase (b), CsSDH (c), and CsCCO (d) in cold stored cucumber fruit. Cucumber fruits were subjected to NO donor SNP (1.0 μM) or water (control). Data presented are mean values ± SD (n = 3). The asterisk denotes statistically significant differences between the treatment and control groups at each time point (*P < .05, **P < .01).
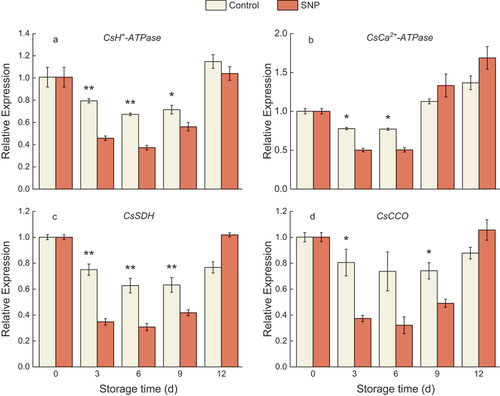
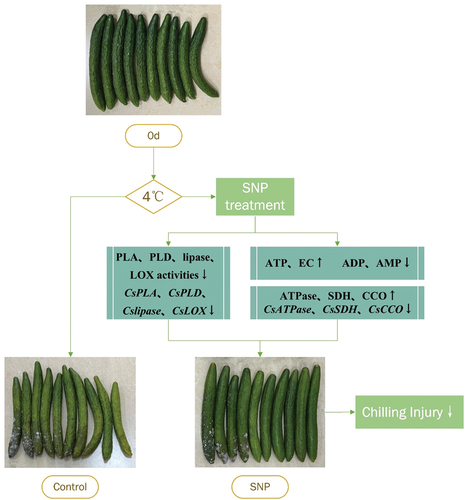
Figure 7. A proposed model shows that membrane lipid and energy metabolism influence chilling injury during cold storage of cucumber fruit.