Figures & data
Table 1. The mobile phase system of HPLC fingerprint analysis.
Figure 1. HPLC chromatograms of EF extracts at different separation conditions. (a) wavelength, (b) mobile phase, (c) modifying agent, (d) column temperature, and (e) flow rate.
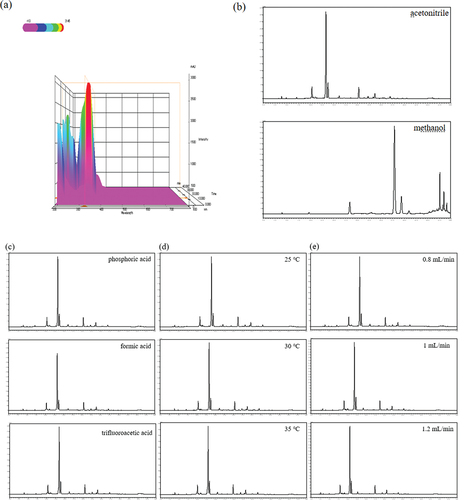
Table 2. Chromatographic analysis results of EF extracts at different separation conditions.
Figure 2. HPLC fingerprints of EF extracts, representative of 12 chromatograms.
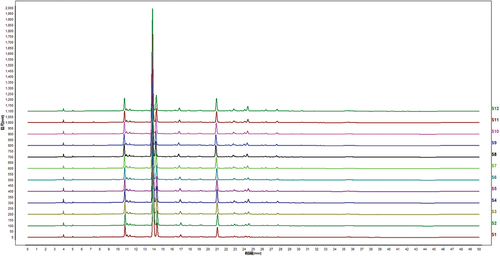
Table 3. Total antioxidant capacity of 12 batches of EF extracts.
Figure 3. Reference atlas from 10 EF extracts chromatograms.
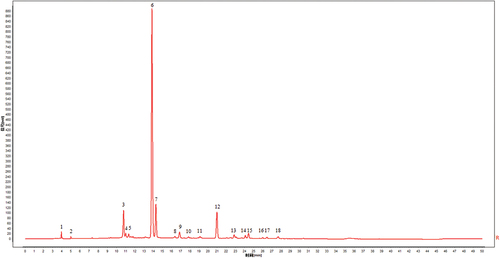
Figure 4. HCA of EF extracts.
Figure 5. Correlations between common characteristic peaks and the antioxidant activity obtained by SIMCA-P.
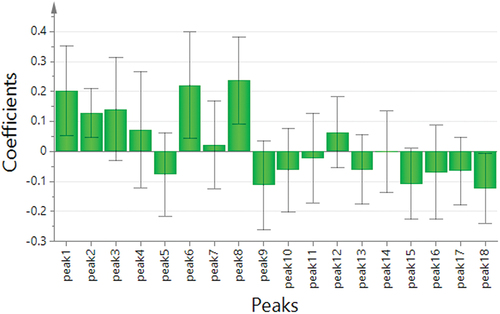
Figure 6. VIP scores of each characteristic peak.
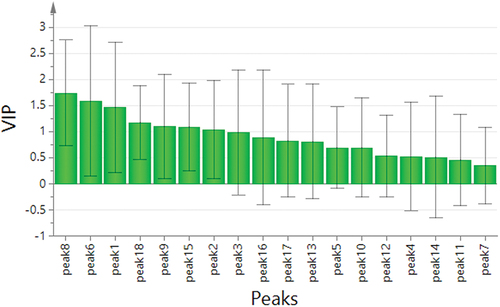
Figure 7. Correlations between common characteristic peaks and the antioxidant activity obtained by Unscrambler X software.
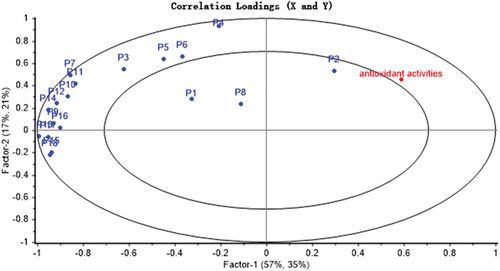
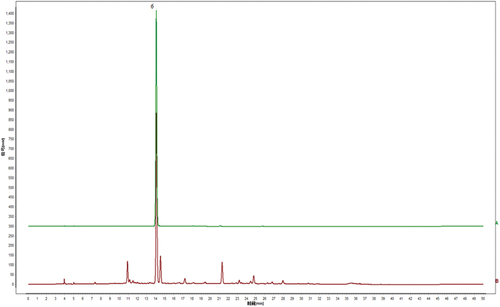
Figure 8. HPLC of chlorogenic acid reference substance (A) and EF extract (B).